All bites
The whole library, newest first. Filter by what you are here for, or pick a topic if you already know.
8668 bites
Page 217
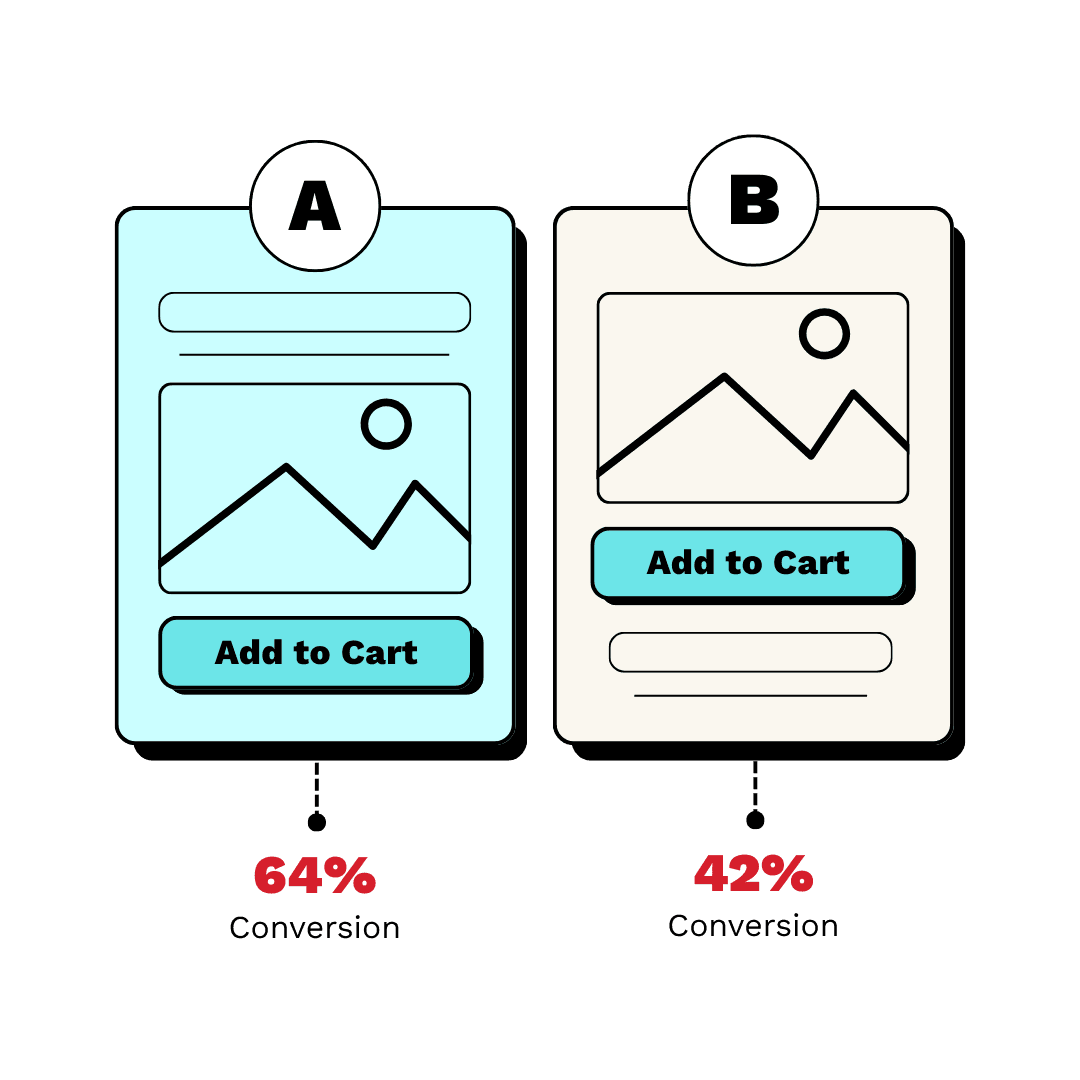
How do you determine sample size and duration for an A/B test?
This tests your grasp of statistical power and business trade-offs. A good answer defines the four inputs (baseline, MDE, significance, power) to calculate sample size, then uses traffic to find duration.

How would you A/B test a 'Buy Now' button color change?
Tests your grasp of the A/B testing lifecycle. A strong answer defines a clear hypothesis (e.g., 'a green button will increase clicks'), selects a primary metric (CTR), and considers guardrail metrics. A red flag is skipping the hypothesis and metrics.
Why can't we t-test p99 latency in an A/B test?
This tests if you know why t-tests fail for percentiles. A t-test requires a normally distributed statistic (like the mean), but a sample p99's distribution isn't normal.

Explain Simpson's Paradox with a user engagement example
Tests if you see beyond aggregate data. Define the paradox, give a numerical example where a feature fails overall but wins in segments (e.g., new vs. returning users), and name the confounding variable. A vague definition without numbers is a red flag.
DAU dropped 10% overnight. Is this a significant change?
Tests your use of statistical hypothesis testing on business metrics. Outline the process: state a null hypothesis (no change), choose a Z-test, calculate the p-value, and compare to an alpha of 0.05. A red flag is guessing causes before proving significance.
Explain correlation vs. causation with a software example
This tests your critical thinking about data and ability to avoid logical fallacies. A good answer defines both terms, then gives a software example where a third, confounding variable (like traffic) is the true cause of two correlated metrics.
A/B test p-value is 0.08, PM wants to ship. What now?
Tests if you can translate statistical risk into business terms for a PM. A good answer defines the 8% false positive risk, weighs it against the cost of shipping, and suggests next steps like running the test longer instead of just saying no.
What does a p-value of 0.03 mean in an A/B test?
This tests your grasp of statistical significance and ability to make a data-driven decision. A great answer defines p-value, compares it to alpha (0.03 < 0.05), and concludes to reject the null hypothesis. A red flag is misstating the p-value's definition.
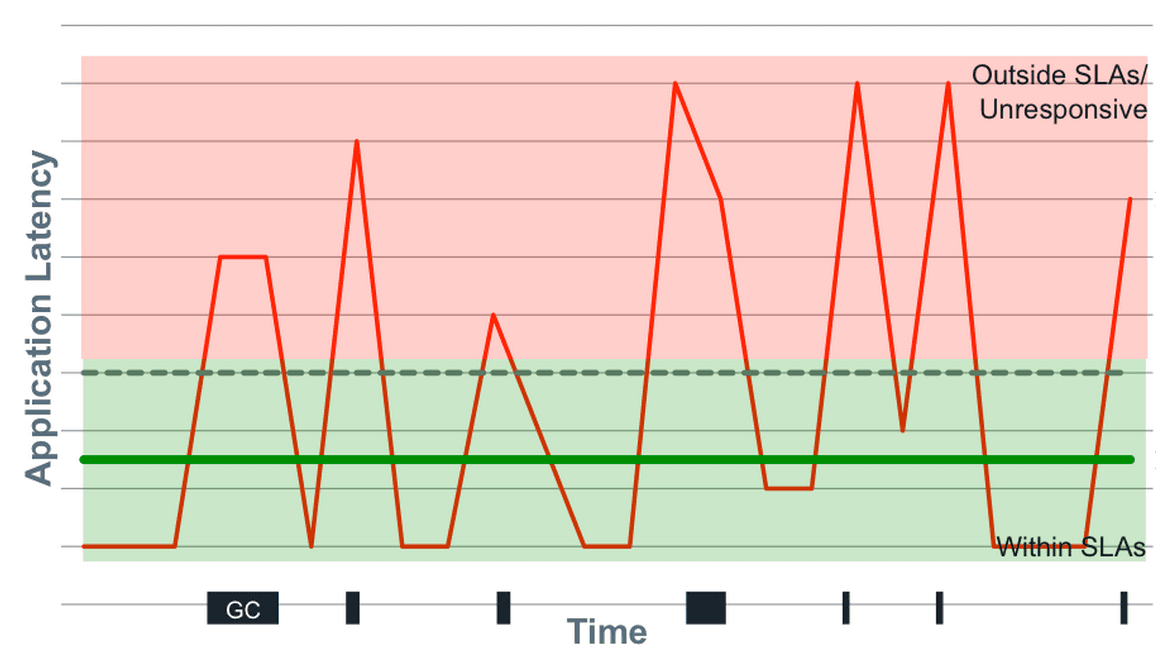
Mean vs. Median for API Response Times?
Tests your understanding of non-normal distributions like latency. Choose median as it's robust to outliers that skew the mean. Then, state that even median is insufficient; percentiles (p99, max) are crucial for capturing the full user experience.

Design a Fast, Multi-Dimensional Analytics Dashboard
This tests your grasp of data warehousing trade-offs for analytics. A great answer compares OLAP cubes (fast, pre-computed) vs. columnar DBs (flexible, real-time), then proposes a hybrid model.
How would you validate a feature's success, correcting for self-selection?
This tests your ability to separate correlation from causation. A great answer identifies self-selection bias, proposes a quasi-experimental method like Propensity Score Matching to create a control group, and then compares outcomes.
A/B Test Results with Skewed Traffic: What's Next?
This tests your ability to spot confounding variables. A good answer invalidates the results due to sampling bias, proposes segmenting the data by device to find the true effect, and suggests re-running the test with correct randomization.

How to query a monthly cohort retention table in SQL?
Tests your ability to translate a core business metric into a multi-step SQL query. A good answer finds each user's acquisition month, joins that back to their activity, and pivots the data into a cohort grid. A red flag is calculating aggregate retention.

Average latency is up 50ms, but p99 is flat. How do you diagnose this?
Tests your grasp of latency metrics. A rising average with flat p99 means the *bulk* of requests (p50-p90) slowed, not the tail. Hypothesize a common bottleneck and segment data by endpoint/user to find it. Red flag: blaming new, slow outliers.
Is Feature X Causal for 20% Higher Retention?
This tests your ability to separate correlation from causation. A great answer first identifies confounding variables (e.g., power users), then proposes an A/B test to isolate the feature's true effect, and finally suggests quasi-experiments if a test isn't…
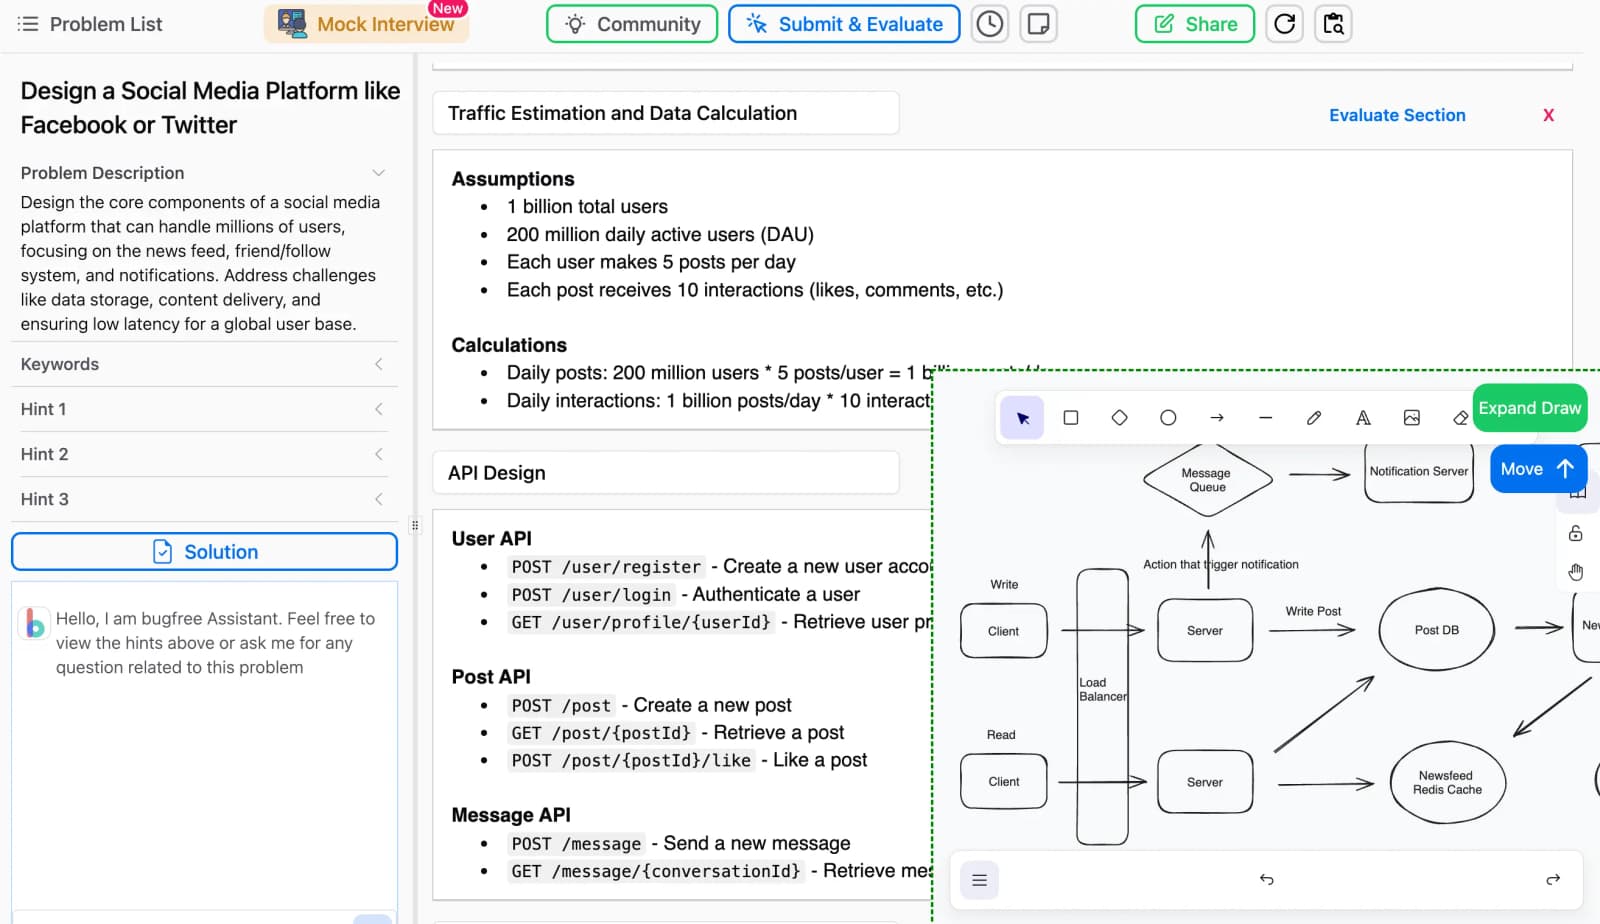
DAU dropped 10%. How do you investigate?
Tests structured problem diagnosis. First, verify the data isn't corrupt. Then, segment the drop by user type (new vs. returning), platform (iOS/Android/Web), and geography to isolate the 'what' before hypothesizing the 'why'.
How would you visually represent statistical uncertainty in a chart?
This tests your ability to accurately communicate statistical significance. A great answer discusses error bars (with 95% CIs), then more advanced options like gradient or violin plots, and frames the choice by audience.
Strategy for Visualizing Millions of Time-Series Points
Tests your strategy for balancing performance and visual fidelity with large datasets. Propose backend downsampling with an algorithm like LTTB to preserve peaks, then discuss multi-resolution data fetching on the frontend.

Explain pre-attentive attributes in data visualization
Tests designing high-signal UIs. Define pre-attentive attributes as visual cues processed instantly (e.g., color, size, shape). Apply one to make key data 'pop' in a dense chart.
Stakeholder claims correlation implies causation. How do you investigate?
This tests your scientific rigor beyond the simple "correlation isn't causation" mantra. Acknowledge the finding, probe for confounding variables, suggest cohort analysis, and propose an A/B test. A red flag is reciting the mantra without a concrete plan.