All bites
The whole library, newest first. Filter by what you are here for, or pick a topic if you already know.
8668 bites
Page 218

How would you design a product management dashboard?
This tests your ability to structure data hierarchically for a specific persona (PM). A great answer outlines a 3-tier structure: summary KPIs, trend analysis, and drill-downs. A red flag is listing charts without explaining how they guide PM decisions.
Bar Chart vs. Line Chart for Market Share Comparison?
This tests your grasp of visualization fundamentals for categorical vs. time-series data. A bar chart is correct for comparing discrete categories (companies) at one point in time. A line chart wrongly implies a trend. Red flag: justifying a line chart.

When is a pie chart an appropriate visualization?
Tests your grasp of data viz principles for part-to-whole data. A good answer defines this use case (e.g., market share), then lists pitfalls like too many slices or comparing multiple pies. A red flag is defending pie charts for complex data.

How do you manage schema evolution in an analytics pipeline?
This tests your grasp of data as a contract. A great answer covers schema registries, backward compatibility, and a phased rollout from producer to warehouse. A red flag is only mentioning an ALTER TABLE command, ignoring the entire data pipeline.
Challenges of Grouping by High-Cardinality Dimensions
This tests your grasp of system-level impacts of data shape. A good answer explains how high cardinality strains memory during aggregation, reduces compression, and inflates index size, leading to slow, expensive queries. A red flag is just saying 'it's slow'.
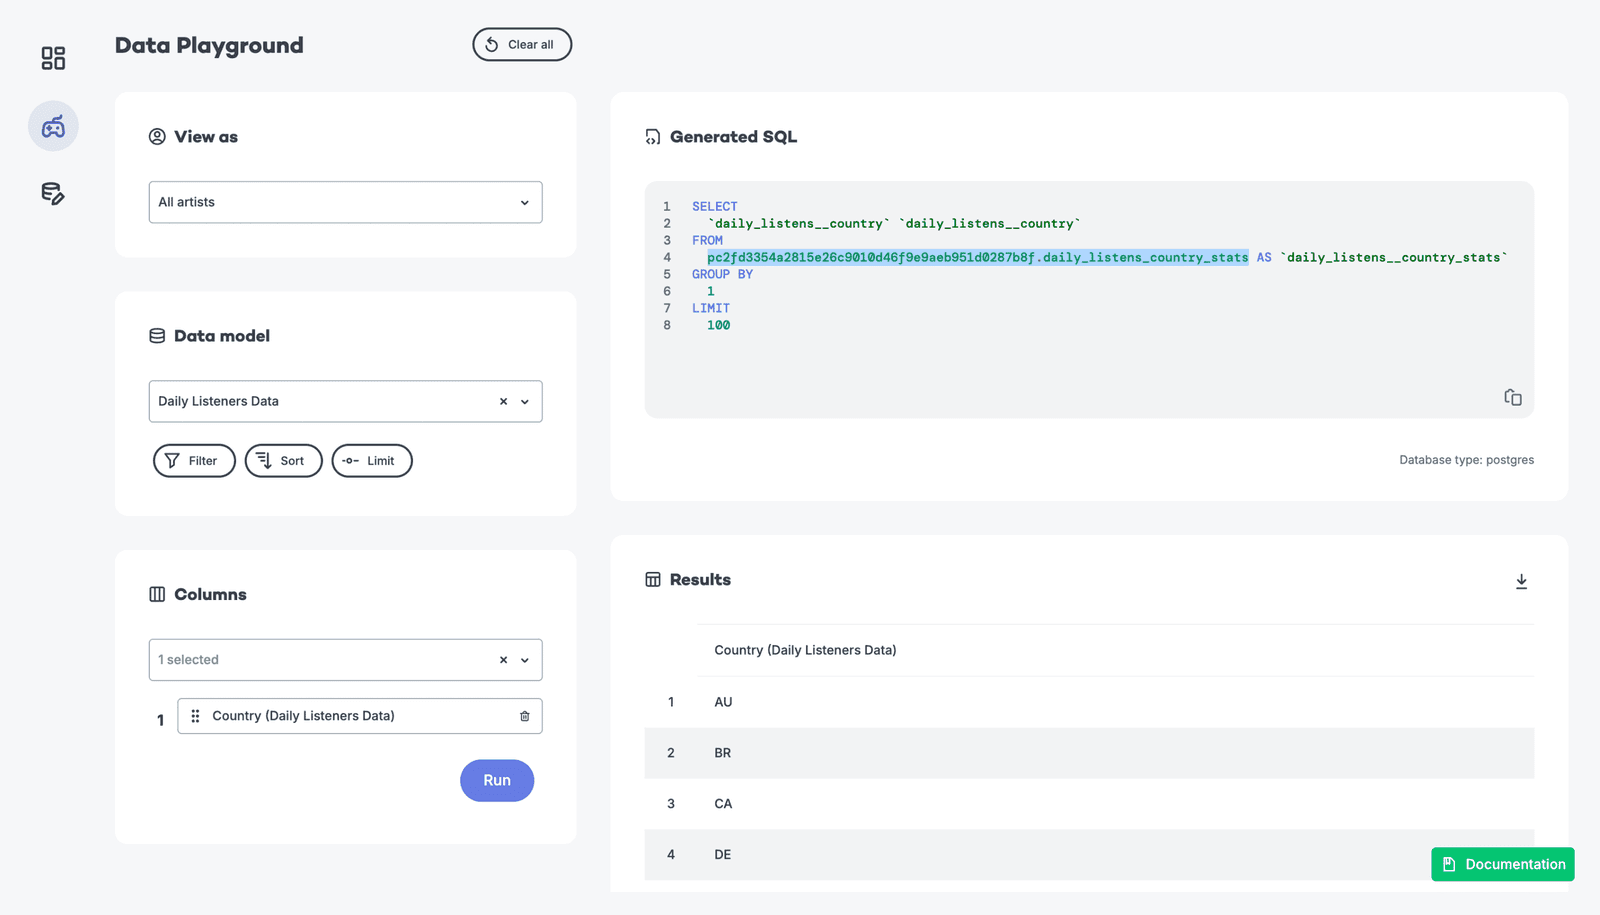
Trade-offs: Pre-aggregation vs. Querying Raw Data
Tests your grasp of data system trade-offs. A great answer weighs pre-aggregation (fast, cheap, stale) against querying raw data (slow, costly, fresh, flexible) and proposes a hybrid solution. A red flag is declaring one method universally superior.

How do you handle duplicate events in an analytics pipeline?
Tests your grasp of data integrity and idempotent processing. Explain how duplicates inflate COUNT(*), then propose adding a unique event_id and using a stateful stream processor to track seen IDs. Mention query-time COUNT(DISTINCT event_id) as an alternative.
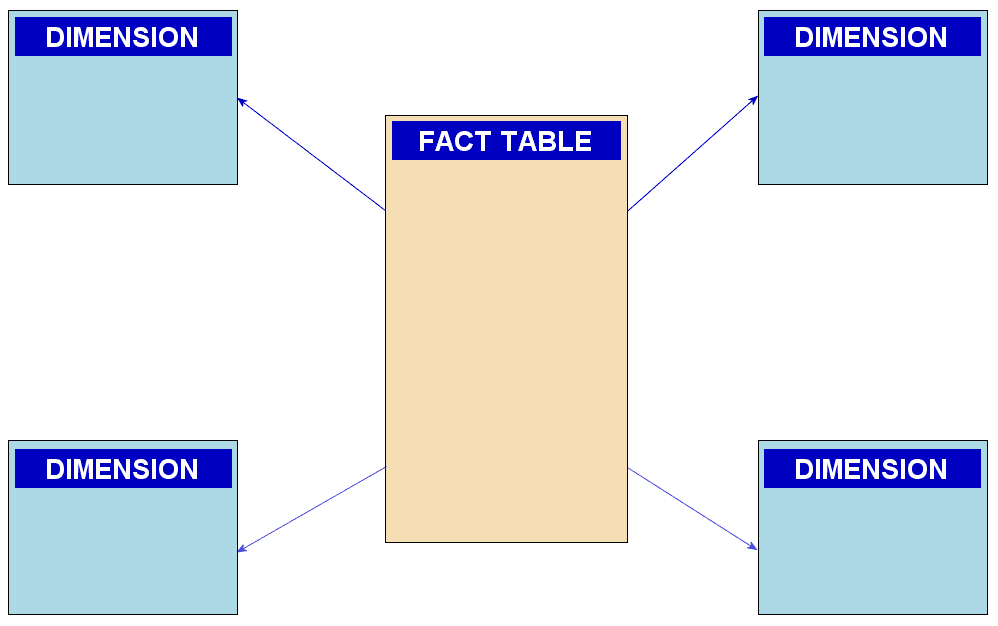
Explain the star schema and its advantages for analytics
This tests your grasp of OLAP vs. OLTP data modeling. A great answer defines fact/dimension tables, explains how denormalization leads to fewer joins and faster queries, and contrasts this with 3NF's focus on write integrity.
How to diagnose a slow dashboard query?
This tests systematic debugging of a data problem. A good answer investigates the query plan first, then the table's physical layout (partitioning/clustering), and finally the BI tool and warehouse load. A red flag is jumping to a solution without diagnosis.
Why use median/p95 for API latency instead of the mean?
This tests if you understand how long-tail distributions make averages misleading for user experience. A good answer explains that median (p50) shows the typical user, while p95 captures the worst-case experience.
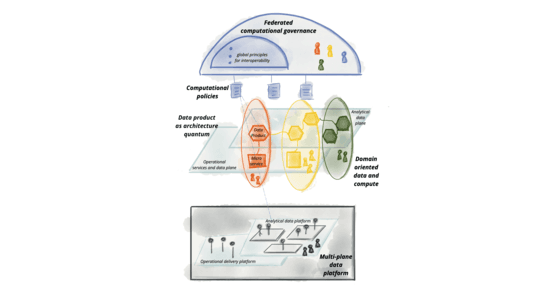
Design a Scalable Data Governance Framework
This tests your grasp of decentralized data architectures like Data Mesh. A great answer proposes a federated model with domain ownership, data as a product, and a self-serve platform.
How do you debug a data quality issue in a complex pipeline?
Tests systematic debugging in distributed systems. A great answer prioritizes containment, traces data lineage from report to source, and proposes specific observability tools.
How do you create a 'golden record' from fragmented data?
Tests your ability to design a data reconciliation system. A great answer outlines a process: profiling sources, defining survivorship rules, implementing a matching engine, and creating a stewardship process. A red flag is suggesting a simple one-off script.
Handle Schema Evolution in a CDC Analytics Pipeline
This tests your ability to design robust data systems that anticipate change. A great answer includes a schema registry, compatibility rules, a dead-letter queue for non-compliant records, and automated alerting.
Explain data lineage and how you would implement it
This tests your ability to design for data observability. Define lineage (origin, transformation, movement), then propose a solution using metadata extraction (OpenLineage) and a central graph store/UI (Marquez) to trace data from microservices to analytics.

What is a data schema and why enforce it on ingestion?
This tests your understanding of data contracts. A great answer defines a schema as a data blueprint, then explains how early enforcement prevents bad data, ensuring consistency and reliability for analytics. A red flag is only defining the term.
What validation checks would you implement for an email field?
Tests your understanding of practical validation vs. theoretical purity. A great answer prioritizes user experience, uses simple syntax checks (like a single '@'), and relies on sending a verification email as the ultimate test.
How would you handle 10% null values in a key column?
This tests your understanding of data cleaning trade-offs. First, investigate the cause of nulls. Then, discuss simple imputation (mean/median) vs. discarding rows, weighing pros and cons. A red flag is jumping to a solution without asking about the data.

Design a framework for ensuring data quality and integrity
This tests your ability to design a proactive, multi-layered data quality system, not just reactive fixes. Start with governance (roles/ownership), then detail profiling, validation, and cleansing. Finally, discuss lineage. Red flag: focusing only on one tool.
Diagnosing Out-of-Memory Errors in a Spark Job
This tests your systematic debugging of distributed systems. A great answer first diagnoses the failure location via the Spark UI, then investigates data skew and code inefficiencies, and finally tunes memory configs.