How do you reconcile conflicting qualitative stories with quantitative data?
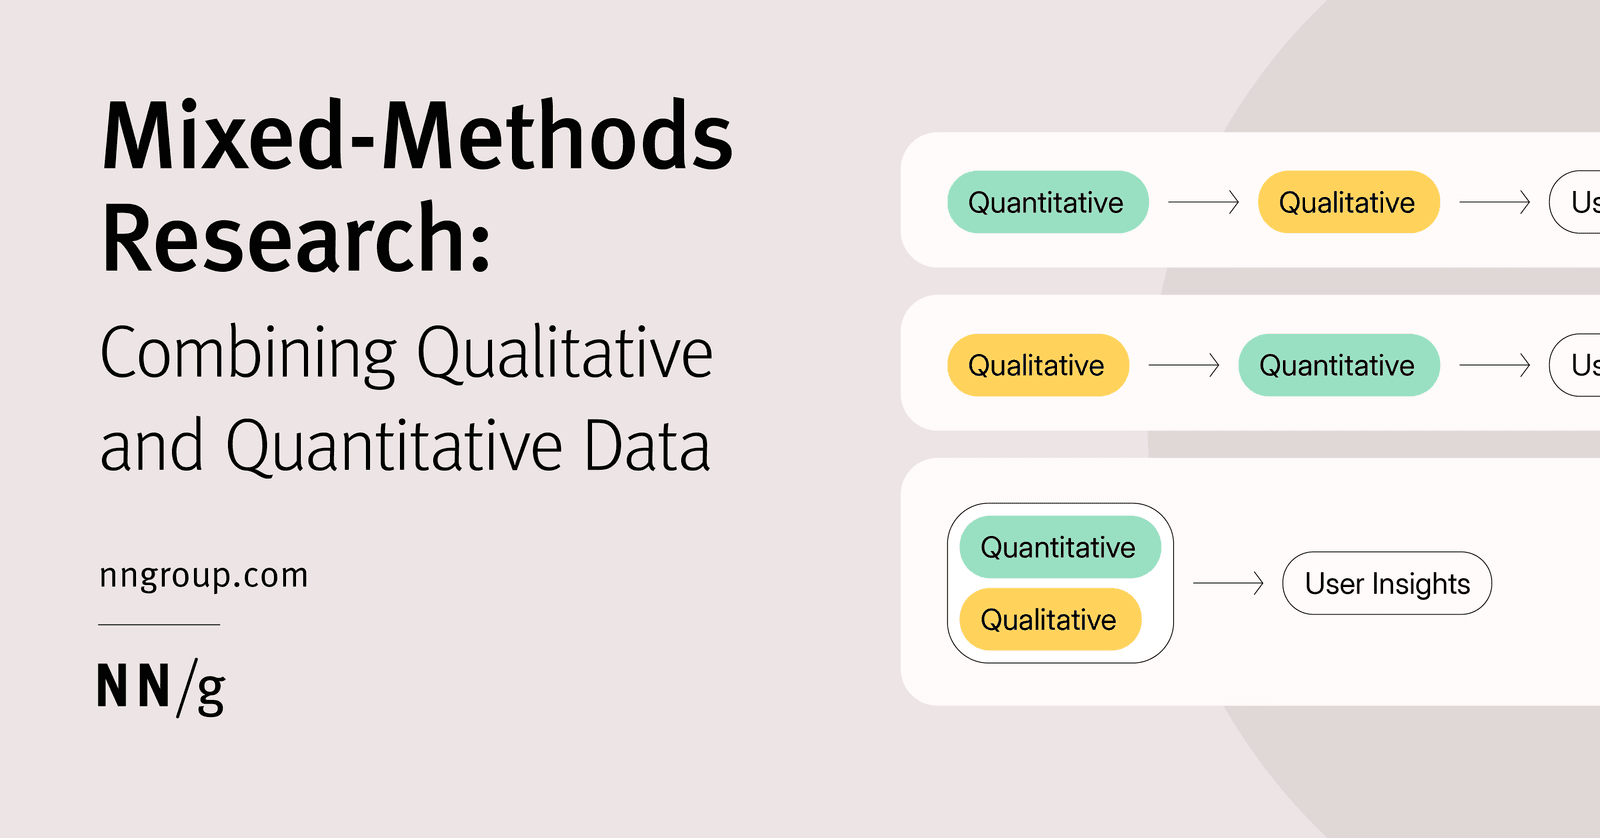
Integrating mixed-methods without picking sides. A strong answer triangulates definitions, scope, and timing; uses qualitative context to explain outliers; and treats conflict as a signal to dig deeper.
What's really being asked
This question probes your mixed-methods fluency. The interviewer wants to know if you see qualitative stories and quantitative data as complementary lenses rather than competing truths. Senior researchers are expected to hold tension between narrative and numbers without collapsing one into the other, and to use that tension to refine the underlying research question.
The full answer
First, audit for methodological alignment by checking whether the qualitative and quantitative datasets actually measure the same thing. This means comparing definitions of success, user segments, time periods, and task framing. Second, look for scope differences: analytics capture broad behavioral patterns while interviews reveal motivations from a small sample, so a story may reflect an edge case that does not invalidate the aggregate trend. Third, use qualitative findings to explain quantitative outliers rather than treating them as errors. Fourth, propose a concrete integration plan such as a follow-up survey to validate the story at scale, or a segmented analysis to see if the behavior appears in a specific cohort. Fifth, communicate the reconciliation to stakeholders by presenting both streams as a layered insight that connects what is happening with why it is happening.
The mistakes people make
A major red flag is defaulting to the data you trust most, for example calling user stories merely anecdotal or claiming analytics are broken without evidence. Another mistake is asking the researcher to rerun the study without first examining whether the conflict stems from different definitions or populations. Simply averaging or forcing agreement between the two sources also signals shallow synthesis.
What usually comes next
The interviewer may ask how you would handle stakeholders who only believe numbers, or how you would redesign the study if you could plan it again. They might also probe whether you would change the product based on a small-sample story when analytics show the opposite behavior at scale.
A concrete example
Suppose analytics show a 70 percent task-abandonment rate on a checkout flow, but usability interviews reveal that users feel confident and in control. On investigation, you discover the analytics define abandonment as any session over five minutes, while qualitative sessions show users are comparison shopping across tabs and returning to complete purchase. The resolution is not to pick one truth but to redefine the metric to account for multi-tab behavior and to add a qualitative checkpoint about perceived control.
Interview question
Analytics show high checkout abandonment, but interviews reveal users feel confident. What is the strongest first step to reconcile these findings?
- a.Average the abandonment rate with the confidence scores to create a single reconciled metric
- b.Launch a follow-up survey to validate the confidence finding at scale before deciding
- c.Treat the interview findings as anecdotal edge cases and prioritize the abandonment metric
- d.Check whether the analytics and interviews define abandonment, time periods, and tasks the same wayCorrect
Why? this is the answer
The first step is to audit for methodological alignment by comparing definitions, scope, and timing, because the conflict may stem from mismatched metrics rather than contradictory truths. Launching a follow-up survey is tempting but premature: you should first determine whether the datasets actually measure the same behavior before scaling validation.
Just read this? Test yourself on what you have been reading.
Read the original → nngroup.com
- #mixed-methods
- #ux-research
- #data-triangulation
- #qualitative-quantitative
- #senior-ux
You just looked this up. Could you explain it out loud?
That is the part interviews actually test. Tezvyn takes questions like this one and gives you what the interviewer is really checking, the answer that lands, and the mistake that ends the conversation, in the four minutes before your next meeting.
The iPhone app is on the way
We are building it. Until it lands, nothing here is held back from you: every interview card, your saved cards, streaks and the job board all work in Safari, plus hundreds of free practice quizzes of thirty questions each. Sign in and it all carries over to the app the day it arrives.
Want it as an icon? Tap Share at the bottom of Safari, then Add to Home Screen. It opens full screen and the cards you have read stay available offline.
We are hiring for this. Every open role lists the topics its interview covers, so you can prepare for the real thing rather than guessing.
See open roles