What is an Experimentation Stats Engine?
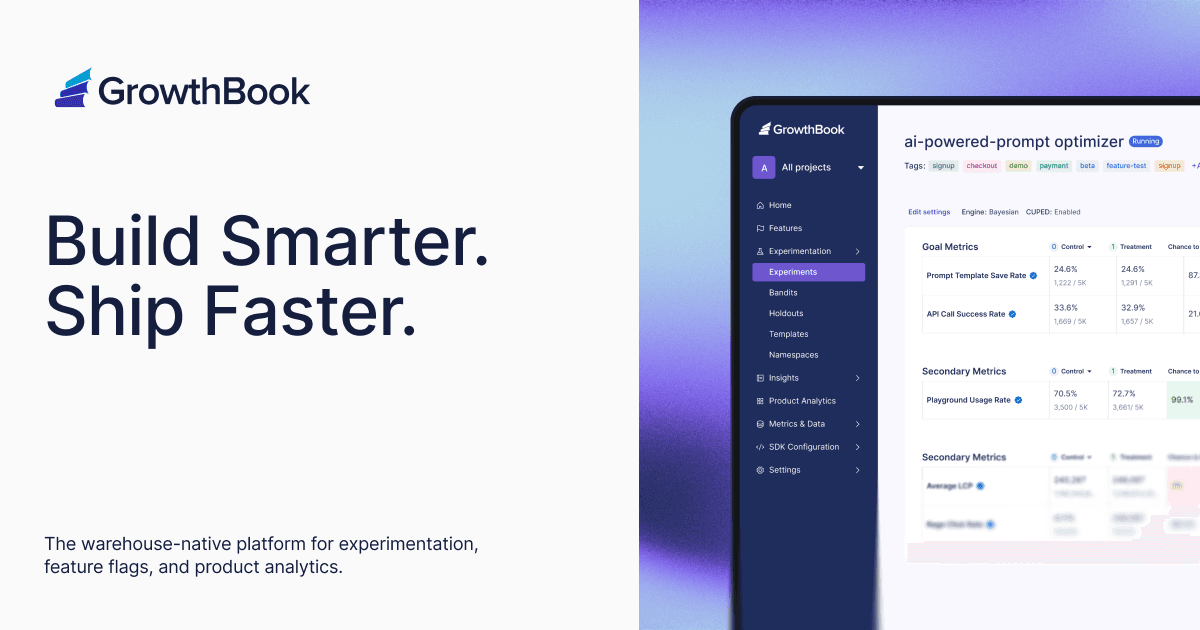
A stats engine is the brain of an A/B testing platform, turning raw data into reliable 'which version won?' decisions. It powers tools that analyze feature rollouts, ensuring statistical rigor.
WHY IT EXISTS: Companies run experiments to make data-driven decisions, but raw user data is noisy. A statistical engine exists to separate the signal (a real effect from a change) from the noise (random user behavior) in a repeatable, trustworthy way, preventing teams from chasing phantom improvements.
THE MENTAL MODEL: Think of a stats engine as a specialized judge in a courtroom for product ideas. It doesn't just count clicks or conversions. It applies strict rules of evidence (statistical tests) to the data in your warehouse to determine if a change is 'guilty' of causing an improvement beyond a reasonable doubt (statistical significance).
HOW IT WORKS: A modern, warehouse-native stats engine connects directly to your company's data warehouse where user events are stored. Data scientists or engineers define key metrics using SQL. The engine then runs these queries for both the control and variant groups, applies its statistical model to the results, and calculates metrics like lift, p-values, or confidence intervals to determine if there is a winner.
WHEN TO USE IT: Use a dedicated stats engine when you graduate from one-off analyses to a systematic experimentation program. It's essential for standardizing metrics across an organization, managing hundreds of concurrent experiments, and creating a central, scalable source of truth for product decisions.
WHEN NOT TO USE IT: For a quick, one-off analysis on a small dataset, a full stats engine can be overkill. A simple script or a Jupyter notebook might be faster for purely exploratory questions. A stats engine is built for production-grade, repeatable decision-making, not ad-hoc data spelunking.
ONE CANONICAL EXAMPLE: An e-commerce site wants to test if a new checkout flow increases purchases. The stats engine is configured to track users exposed to the old flow (control) and the new flow (variant). It queries the data warehouse for conversion events for each group, and after enough data is collected, its dashboard reports whether the new flow has a statistically significant positive, negative, or neutral impact on the purchase rate.
Read the original → growthbook.io
Get five bites like this every day.
Tezvyn delivers a daily feed of 60-second tech bites with quizzes to lock in what you learn.