Advanced everything in AI & ML, page 6
Explain positional encodings in Transformers and their necessity
Explain encodings inject order into embeddings; cite sinusoidal or learned vectors.
AWS Inferentia and Annapurna Labs
AWS Inferentia is an AWS chip product line. Annapurna Labs, Amazon's semiconductor division acquired in 2015, builds Nitro, Graviton, and Trainium and ranks among TSMC's top five fabless customers. Do not assume Annapurna designs every AWS accelerator.
LLM Scaling Laws: Match Parameters to Tokens
For a fixed compute budget, model size and training data must grow equally. When choosing between a larger model or more tokens for the same FLOPs, more data usually wins. The footgun is scaling parameters alone, which undertrains the model and wastes compute.
Explain Regression Discontinuity Design and propose a real-world scenario
Compare units just above and below a threshold for local effects; propose scenario with forcing variable.
How would you estimate causal impact using a quasi-experimental method?
DiD with Canada versus Australia; assert parallel trends; validate with pre-period plots and placebo tests.
K-Means vs DBSCAN: which for geospatial hotspots?
Tests matching algorithmic assumptions to data structure. K-Means needs K and assumes spheres; DBSCAN discovers arbitrary density shapes and labels noise. Choose DBSCAN for geospatial hotspots because density is irregular.

High ROC-AUC but low PR-AUC: what does this imply?
Tests if ROC-AUC hides imbalance while PR-AUC exposes it. Severe imbalance dilutes FPR across many negatives, inflating ROC-AUC, but precision crashes. Critical for rare positives with costly false positives. Praising the model on ROC-AUC alone fails.
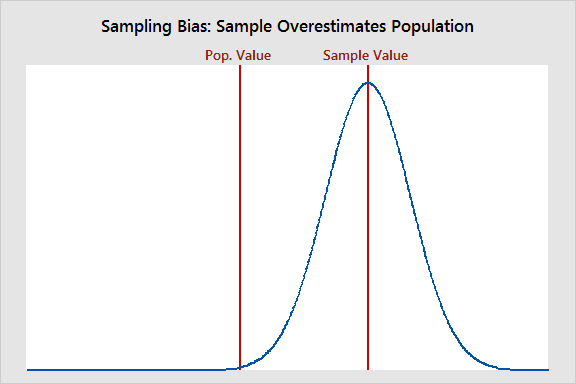
How can EDA and visualization identify dataset bias before modeling?
Tests operationalizing bias detection before modeling. Strong answers compare sample distributions to population norms, audit feature coverage with heatmaps, and track missingness by subgroup. Red flag: citing only class imbalance or ignoring sampling frame.

Describe your systematic approach to interpreting an 8-feature pair plot
Check 8 diagonals for skew; scan 28 off-diagonals for nonlinear trends, variance patterns, and hue clusters; flag redundancy; spot outliers.
How would you visualize high-cardinality categorical relationships?
This tests dimensionality reduction when categories exceed roughly fifty levels. A strong answer proposes top-N aggregation with an other bucket and density or hierarchy plots like heatmaps or treemaps. A red flag is scrolling a bar chart or sampling rows.
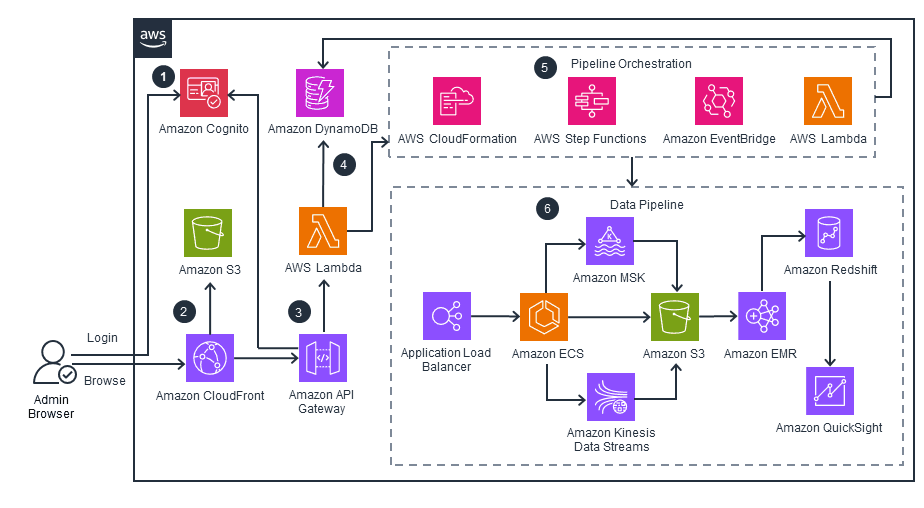
Design a clickstream pipeline from ingestion to data warehouse
Tests data pipeline design under load: buffering, idempotent transform, and warehouse modeling. A strong answer orders ingestion via Kinesis or MSK, Spark EMR sessionization, and Redshift star schemas. Red flag: no buffer and direct warehouse writes.

How would you monitor data quality for a C-level dashboard pipeline?
Designing production data observability for executive dashboards. A strong answer maps freshness SLAs, completeness checks, and distribution drift detection to business impact.
How would you standardize a 500GB dataset that does not fit in RAM?
This tests two-pass statistics for out-of-core scaling. A good answer outlines: first compute mean and variance via sums and counts; second apply z = (x - mean) / std; mention Dask-ML or PySpark. A red flag is averaging chunk-wise means without weighting.
How do you prevent future leakage in time-series preprocessing?
This tests temporal causality in feature engineering and validation. Use only past data for lags and rolling windows and enforce a rolling validation split without shuffling. Red flags are random k-fold CV and global standardization leaking future information.

Design a scalable, fault-tolerant real-time IoT data ingestion system
This tests separation of edge connectivity, buffering, and processing. A strong answer names an edge gateway, Kafka as the backplane, stream processing, and cold storage, plus backpressure and partitioning.
How would you evade an advanced anti-bot system while scraping?
Discuss JA3/TLS spoofing, CDP-based browser automation, human-like mouse paths and delays, and session consistency.

Design an incremental load pipeline from a transactional DB to a warehouse
Contrast timestamp watermarking, CDC from transaction logs, and open-table incremental reads; cite merge logic and idempotency.
How do you analyze and reduce large pandas DataFrame memory usage?
This tests in-memory representation and systematic optimization. Start with df.info(memory_usage='deep'), downcast numerics with to_numeric, convert low-cardinality strings to category, and use nullable dtypes.

Process a 50GB CSV with only 16GB RAM
Chunk with read_csv chunksize, filter columns via usecols, downcast int64 to int32/int16, skip rows.
How do you determine sample size for a conversion lift experiment?
Tests fluency with statistical experiment design. A strong answer frames N as a function of alpha, power, baseline rate, and MDE, noting that shrinking the MDE or raising power inflates N. Red flag: picking N from traffic instead of risk tolerance.
We are hiring for this. Every open role lists the topics its interview covers, so you can prepare for the real thing rather than guessing.
See open roles