Intermediate interview questions in Analytics & Metrics, page 5

Explain Simpson's Paradox with a user engagement example
This tests your understanding of statistical pitfalls in A/B testing. A good answer defines the paradox, gives an example where a feature fails in aggregate but wins in every segment, and attributes it to a confounding variable.
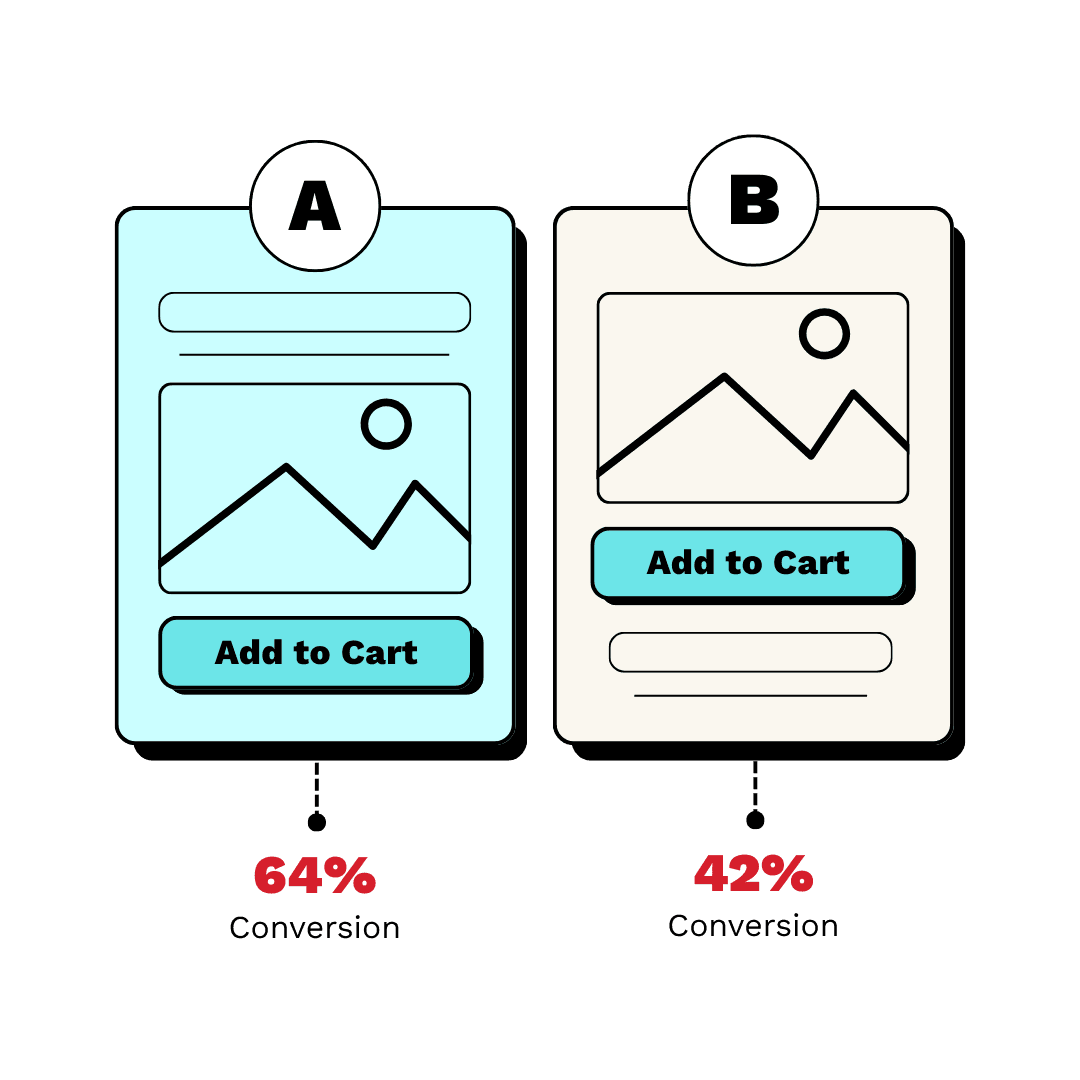
How do you determine sample size and duration for an A/B test?
This tests statistical power literacy. A strong answer names baseline rate, MDE, alpha, and beta; explains the duration versus sensitivity trade-off; and notes traffic allocation. A red flag is ignoring power or stopping early when results look significant.
How do you determine sample size and duration for an A/B test?
This tests your grasp of statistical power and business trade-offs. A good answer defines the four inputs (baseline, MDE, significance, power) to calculate sample size, then uses traffic to find duration.
How do you determine A/B test sample size and duration?
This tests your ability to connect business goals to statistical parameters. A good answer defines the four power analysis inputs (baseline, MDE, alpha, power) and explains trade-offs, then converts sample size to duration using business cycles.

Why is stopping an A/B test at first significance problematic?
Tests peeking and Type I error inflation. Name peeking; explain daily looks inflate false positive rates above nominal alpha; note p-values assume one look at fixed sample size; recommend pre-committed runtimes or sequential testing.
Why is stopping an A/B test early problematic?
Tests understanding of the 'peeking problem' in A/B testing. A good answer defines peeking, explains how it inflates false positive rates, and contrasts it with waiting for a pre-determined sample size. A red flag is not explaining the statistical mechanism.
Why is stopping an A/B test when it hits significance problematic?
Tests your understanding of the 'peeking problem' in A/B testing. A great answer defines peeking, explains how it inflates the Type I error rate (false positives), and states the need for a predetermined sample size.
What is the 'novelty effect' in experimentation?
Tests whether you separate temporary curiosity from durable value. A strong answer defines novelty effect as short-term behavior change triggered by new elements, notes it inflates early experiment lift, and proposes longer runtimes or lagged cohort analysis.
What is the novelty effect in experimentation?
This tests your grasp of temporary user behavior changes that can invalidate A/B tests. A strong answer defines the effect, explains how it inflates metrics, and suggests running tests longer or segmenting by user tenure. A red flag is ignoring mitigation.
Handling the novelty effect in experimentation
This tests your grasp of second-order effects in A/B testing. A great answer defines the novelty effect, explains how it inflates initial metrics, and suggests mitigating it by running tests longer or segmenting by user tenure. A red flag is ignoring it.

What is the difference between a primary metric and a guardrail metric?
Tests whether you distinguish success criteria from safety checks in experiments. A strong answer defines primary metrics as the target outcome, guardrails as protective thresholds, and gives a concrete scenario where a primary lift does not justify shipping…
Primary vs. Guardrail Metrics in Experiments
Tests your grasp of risk management in A/B testing. A great answer defines a primary metric as the goal and a guardrail as a 'do no harm' check. A feature ships only if the primary improves without hurting guardrails.
Primary vs. Guardrail Metrics in Experiments
This tests if you can balance improving a key metric with not harming the user experience. Define primary (the goal) and guardrail (don't harm) metrics. Give an example where a guardrail regression (e.g., latency) blocks a feature ship.
Stationarity in time series and why ARIMA needs it
Constant mean/variance/autocovariance; ARIMA's coefficients assume them; test with the ADF test and ACF plots; achieve it via differencing or log transforms.
Explain time series stationarity and how to achieve it
Tests your grasp of core time series assumptions. Define stationarity (constant mean/variance over time), explain why models need it for stable predictions, and name methods to test and achieve it. A red flag is just saying the data looks 'flat'.
Explain stationarity in a time series
This tests your grasp of core time series modeling assumptions. A strong answer defines stationarity (constant mean/variance), explains its importance for ARIMA (stable patterns), and names a test (ADF) and a fix (differencing).

Random split vs walk-forward validation in forecasting
Random splits leak future data into training; walk-forward validation rolls the origin ahead, testing only on later observations.
Train-Test Split vs. Time-Series Cross-Validation
This tests your grasp of data leakage in temporal data. A good answer explains why random splits create lookahead bias, then details how rolling-origin validation respects time. A red flag is just describing methods without explaining *why* one is necessary.
Train-test split vs. time-series cross-validation?
Tests if you see why temporal data breaks random splits. Contrast random sampling with sequential 'walk-forward' validation, where you only use past data to predict the future.
Which classical baseline model handles weekly seasonality and upward trend?
Tests matching model structure to data characteristics. Name Holt-Winters triple exponential smoothing; map its level, trend, and seasonal equations to weekly period. Red flag: jumping to SARIMA without explaining why ETS is the natural baseline.
We are hiring for this. Every open role lists the topics its interview covers, so you can prepare for the real thing rather than guessing.
See open roles