Easy interview questions in Data Science & Analytics
Most efficient way to convert list of dicts to pandas DataFrame
Tests knowledge of DataFrame construction versus repeated row-wise assembly. Answer: pass the list directly to pd.DataFrame(data); it aligns missing keys as NaN. Red flag: recommending iterative DataFrame building.
Pandas loc versus iloc indexing
Loc selects by label and is inclusive of both endpoints; iloc selects by integer position and is exclusive of the stop; passing a string label to iloc fails.
Describe strategies for handling missing values in pandas DataFrames
Tests practical judgment on cleaning trade-offs. Good answers contrast dropna when data is abundant against fillna imputation to preserve rows, noting bias risk. Red flag: prescribing one fix without asking why values are missing or what the model needs.
Find customers who have not placed any orders
Tests SQL anti-join logic. Great answers show two paths: LEFT JOIN plus IS NULL on orders.customer_id, or NOT EXISTS, and mention NULL safety with NOT IN. Red flag: INNER JOIN with DISTINCT, which silently drops customers without orders.

How do you fetch JSON from a REST API and parse it?
This tests practical fluency with HTTP mechanics and JSON deserialization. A strong answer names the method, URL, and headers; checks the status code; then parses with r.json() or json.loads. A red flag is skipping error handling or confusing GET with POST.
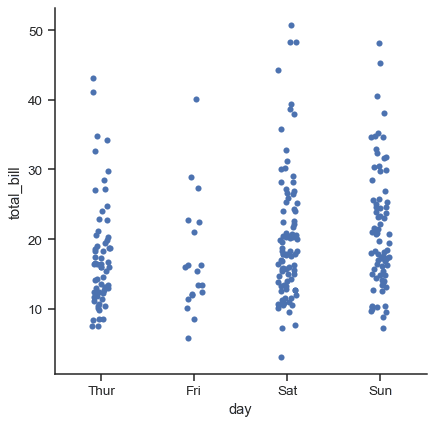
Which plot visualizes a continuous versus categorical variable and why?
This tests categorical plot selection for continuous vs categorical relationships. A strong answer names boxplots or violinplots for distribution shape and outliers, or swarmplots for density, and cites median spread, skew, and anomalies.
Explain correlation vs causation and heatmap limitations in EDA
Tests whether you distinguish association from causal mechanism. A strong answer defines both, shows heatmaps spot multicollinearity in EDA, and warns that color ignores confounders and non-linear links. Red flag: claiming high correlation proves causation.
Min-Max scaling vs Z-score standardization: differences and algorithm preferences
Tests if you know how feature scaling works and can pair a scaler with algorithmic assumptions. Contrast [0,1] Min-Max against mean-zero Z-score, then defend standardization for PCA or gradient descent.

Why avoid one-hot encoding for high cardinality and what are alternatives?
This tests dimensionality explosion and encoding alternatives. A strong answer notes one-hot creates many sparse binary columns, increasing memory and compute costs, then names strategies such as target encoding or feature hashing and explains leakage safeguards.
Why is accuracy misleading for fraud detection, and what metrics instead?
Tests recognition of class imbalance. A good answer notes that labeling all transactions as legitimate gives 99% accuracy while catching zero fraud, then recommends precision, recall, F1, and AUC-PR. Red flag: defending accuracy or ignoring false negatives.
How does K-Means clustering work and how do you choose K?
Tests centroid-based partitioning and hyperparameter tuning. Explain iterative assignment to nearest means and variance reduction, then cite elbow method, silhouette score, or domain knowledge for K. Red flag: choosing K without quantitative justification.
What is a p-value? Interpret p = 0.03 at alpha = 0.05.
Tests frequentist testing and p-value misinterpretations. Define p-value as the probability of data this extreme under the null; since 0.03 < 0.05, reject the null at 5%. Never say it is the probability the null is false or the result is due to chance.

What are your null and alternative hypotheses for this A/B test?
This tests translating a directional business question into statistical hypotheses. A strong answer states H0 as no improvement (or a point-null equality for a specified test) and H1 as green outperforming blue. A red flag is framing H0 as 'blue is better' or changing the tail after seeing data.
What metrics track e-commerce user engagement and how do you prioritize them?
Track product discovery, add-to-cart, checkout, purchase, repeat purchase, and engagement signals; prioritize by conversion, revenue, retention, and customer value.

How would you validate that search users are more likely to purchase?
This tests correlation versus causation in product analytics. A strong answer defines the purchase window, matches searchers to similar non-searchers, and picks a statistical test. A red flag is running a t-test without controlling for user intent or time.
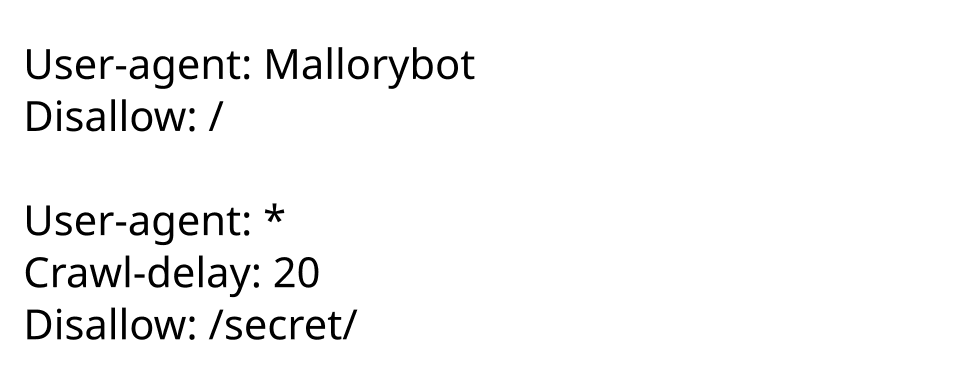
What is robots.txt, why respect it, and consequences of ignoring it?
It disallows crawler paths via the Robots Exclusion Protocol; honoring it prevents server strain, legal risk, and broken trust.
Handling missing numerical values
Dropping rows is simple but loses data and can bias if missingness is non-random; mean or median imputation keeps rows but shrinks variance and ignores correlations; model-based imputation is…

Describe the difference between ETL and ELT and when to choose each
Tests transform timing and compute location. ETL cleans data before loading via external engines; ELT loads raw data first, then transforms in the warehouse. Pick ETL when pre-load cleansing is needed, ELT when warehouse compute is cheaper.
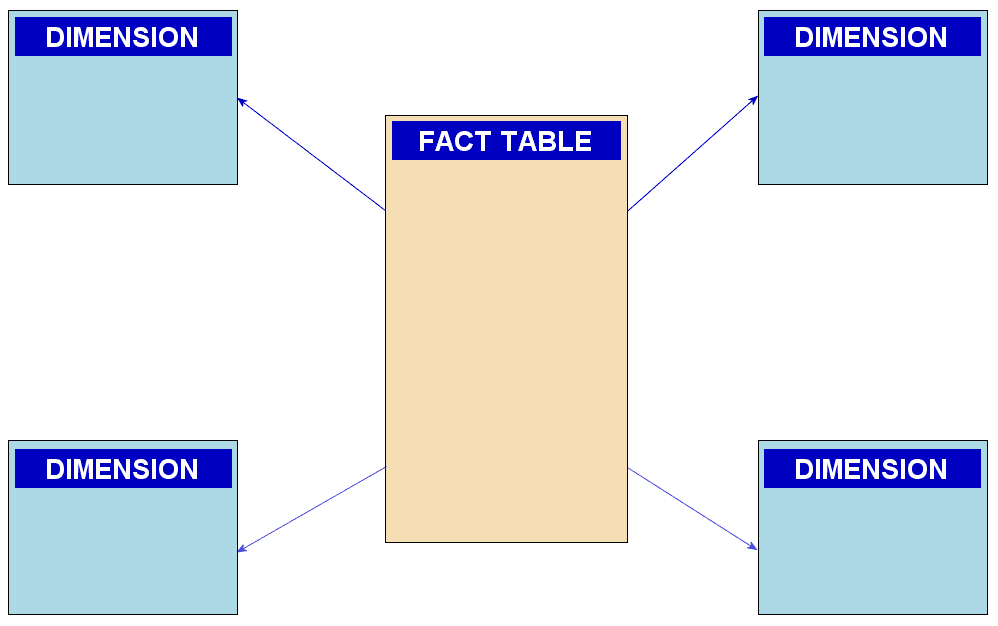
Star schema vs snowflake schema: differences and trade-offs
Tests dimensional modeling: star schemas flatten dimensions for fast joins and simple queries, while snowflakes normalize them to cut redundancy at the cost of extra joins. Red flag: praising snowflake storage savings without admitting query overhead.
First steps to identify and handle missing values
Tests systematic diagnosis before imputation. Strong answers visualize nulls, classify MCAR/MAR/MNAR, and contrast mean imputation with KNN, weighing bias versus complexity.
We are hiring for this. Every open role lists the topics its interview covers, so you can prepare for the real thing rather than guessing.
See open roles