Easy everything in Data Science & Analytics
Quantifying performance disparity across subgroups
Compute per-group precision, recall, FPR, FNR, compare via fairness metrics; visualize with grouped bars or per-group confusion matrices.
Programmatically detect and redact PII in text
Regex for structured PII plus NER for names and places, redact or tokenize, then validate recall.
Batch prediction versus online real-time prediction
Batch is scheduled bulk scoring, online is low-latency per-request scoring; contrast latency, freshness, cost; give a use case each.
Deploy a saved model as a REST prediction service
Load the artifact, wrap it in a predict API, containerize, host with autoscaling, add monitoring.
Visualizing long-term trend versus seasonality
A line chart over the full three years, often with a moving average, shows the long-term trend; a seasonal plot overlaying each year by month, or a month-of-year box plot, reveals…
The MapReduce paradigm explained
Map applies a function to each input record emitting key-value pairs in parallel; a shuffle groups values by key; reduce aggregates each key's values into a result.
HDFS purpose and fault tolerance
HDFS stores huge files across many commodity machines as large blocks, replicating each block across nodes for fault tolerance; unlike NTFS or ext4 it is distributed, write-once, and optimized for…
Spark transformations versus actions
Transformations like map and filter are lazy and build a lineage DAG returning a new RDD; actions like count or collect trigger execution and return a value to the driver.
Handling missing numerical values
Dropping rows is simple but loses data and can bias if missingness is non-random; mean or median imputation keeps rows but shrinks variance and ignores correlations; model-based imputation is…
Pandas loc versus iloc indexing
Loc selects by label and is inclusive of both endpoints; iloc selects by integer position and is exclusive of the stop; passing a string label to iloc fails.

What is a word embedding and how does it beat one-hot encoding?
Tests dense semantic vectors versus sparse one-hot representations. A good answer defines embeddings as learned real-valued vectors where similar words are close, contrasts them with orthogonal one-hot vectors lacking similarity, and names Word2Vec or GloVe.
What is overfitting and how does Dropout prevent it?
Tests generalization intuition: overfitting is low train error but high test error. Good answers say dropout randomly zeros hidden units during training to stop co-adaptation. Bad answers say dropout permanently deletes neurons or just reduces capacity.
Explain vanishing and exploding gradients and common mitigation techniques.
Why deep backpropagation causes diverging gradient magnitudes. Repeated multiplication across layers shrinks or explodes gradients; cite tanh [0,1] range; list ReLU, batch norm, and gradient clipping. Blaming activation choice alone without citing depth.
A/B test: 0.1% lift. Statistical vs practical significance?
Statistical significance says the 0.1% is real; practical significance asks if revenue exceeds engineering cost. Frame with CIs and ROI.
P-value vs confidence interval in an A/B test
A p-value gauges evidence against the null; a 95% CI shows plausible effect sizes and precision.
How do you determine required sample size for an A/B test?
Tests statistical power and experimental design. Name four inputs: baseline conversion rate, minimum detectable effect, alpha (5%), and power (80%), then solve for N. Red flag: "test until significant" or fixed guesses like 1000 users without effect size.
How does K-Means clustering work and how do you choose K?
Tests centroid-based partitioning and hyperparameter tuning. Explain iterative assignment to nearest means and variance reduction, then cite elbow method, silhouette score, or domain knowledge for K. Red flag: choosing K without quantitative justification.
Why is accuracy misleading for fraud detection, and what metrics instead?
Tests recognition of class imbalance. A good answer notes that labeling all transactions as legitimate gives 99% accuracy while catching zero fraud, then recommends precision, recall, F1, and AUC-PR. Red flag: defending accuracy or ignoring false negatives.
Explain correlation vs causation and heatmap limitations in EDA
Tests whether you distinguish association from causal mechanism. A strong answer defines both, shows heatmaps spot multicollinearity in EDA, and warns that color ignores confounders and non-linear links. Red flag: claiming high correlation proves causation.
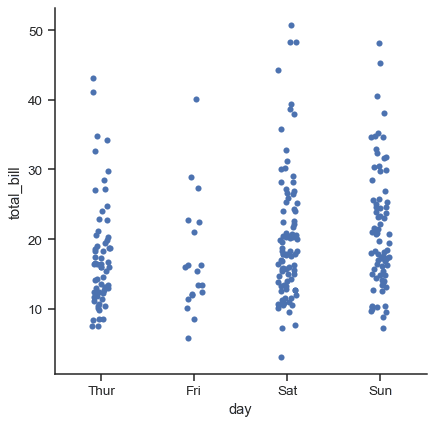
Which plot visualizes a continuous versus categorical variable and why?
This tests categorical plot selection for continuous vs categorical relationships. A strong answer names boxplots or violinplots for distribution shape and outliers, or swarmplots for density, and cites median spread, skew, and anomalies.
We are hiring for this. Every open role lists the topics its interview covers, so you can prepare for the real thing rather than guessing.
See open roles