Everything in Design & UX, page 11

How does continuous discovery change the researcher's role with engineering?
Tests whether you view researchers as trio enablers rather than study owners. A strong answer covers shifting from running studies to coaching engineers on interviews and assumption testing via shadowing and paired sessions.

How would you prioritize a live usability fix during a full sprint?
Cross-functional negotiation and prioritization under fixed capacity. Present failure-rate or ticket data, map the fix on an impact-effort matrix, and jointly swap a low-impact sprint item or schedule a hotfix.
What research validates a three-sprint feature without delaying engineering?
One week of interviews and prototype tests, with concept testing while engineering spikes.

How do you translate field-study findings into user stories and acceptance criteria?
Tests turning qualitative findings into engineer-ready backlog items. Strong answers: synthesize personas from observations, map pain points to epics, break into As-I-want-so-that stories with acceptance criteria, and co-create with engineers.
How would you usability-test a feature-flagged staging component?
Tests if you know usability testing works early. Strong answer: realistic tasks with careful wording to avoid priming; facilitator observes behavior and asks followups without influencing participant; staging is just another interface.

How do you share research findings with engineers so they stay actionable?
Tests whether you respect engineering workflows. Offer tiered formats like quick decks, shared docs, or raw notes; embed insights into tickets; anchor findings to user quotes for trade-offs. Red flag: forcing live attendance or sharing long standalone decks.
What research do you give an engineer starting a new feature?
This tests distilling research into actionable engineering guidance. A strong answer gives the engineer a validated problem statement and user context, delivered in the ticket or a five-minute sync. A red flag is handing over a full research deck or raw notes.
How would you architect a unified quantitative and qualitative user experience view?
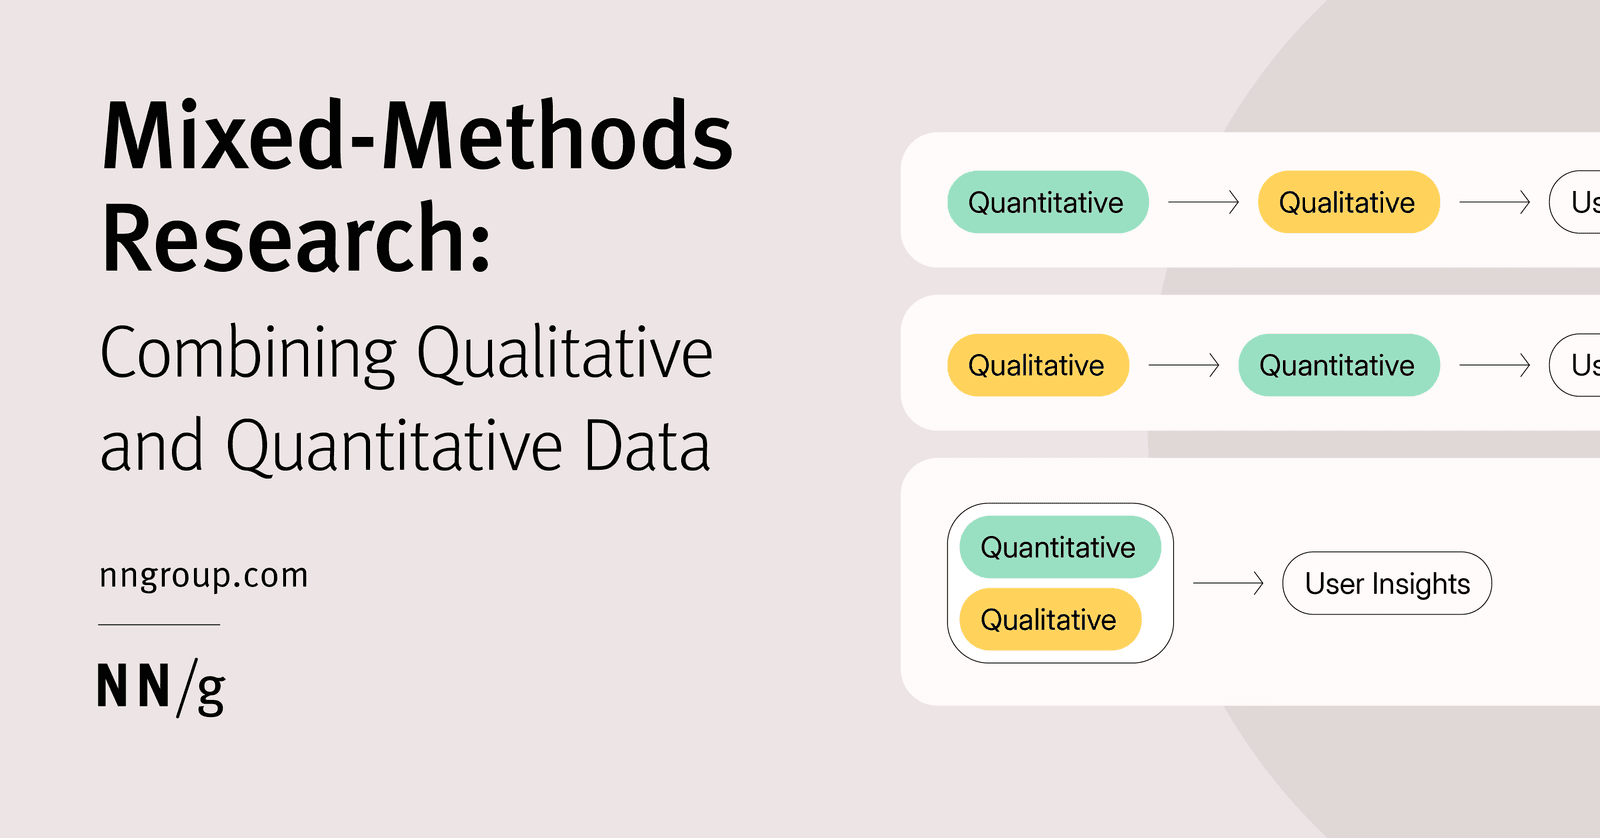
This tests intentional mixed-methods integration. A strong answer covers: shared research questions and user IDs; using quant struggles to guide qual interviews; linking datasets by session.

How would you architect a centralized research repository for heterogeneous data types?
Tests designing systems that unify unstructured UX artifacts into a queryable graph. Cover: ingestion with transcription, a metadata schema linking insights to evidence, and faceted cross-type search. Red flag: a flat file dump without structured tagging.
How do you reliably deliver a survey to 10,000 users?
Tests systems thinking for outreach at scale. Strong answers cover idempotent delivery, rate-limited async sending, PII handling and retention, plus observability into delivery and response rates.
Design a database schema for a research participant panel
Your ability to normalize relational data without over-engineering. Propose a participants table for contact and demographics; a participation_history table with foreign keys; and a consent_log table.
How do you use research to build a case for architectural investment?
Quantify churn, tie UX debt to revenue, propose phased rollout, anchor to strategy.
How do you reconcile conflicting qualitative stories with quantitative data?
Integrating mixed-methods without picking sides. A strong answer triangulates definitions, scope, and timing; uses qualitative context to explain outliers; and treats conflict as a signal to dig deeper.
What metrics and models link onboarding to long-term retention?
Track activation-to-D90 metrics; use Cox/AFT or diff-in-diff; control censoring.
Explain statistical power and respond to extending a null A/B test
This tests statistical power and p-hacking judgment. A strong answer defines power as detecting a true effect, rejects extending the test to chase significance, and requires pre-registered sample sizes. Agreeing to run until it hits significance is a red flag.

What is the multiple comparisons problem in UX research?
This tests whether you know running many tests inflates false positives. Strong answers define family-wise error, give a UX example like comparing twenty metrics in one A/B test, and name a correction like Bonferroni.
How many users do we need to survey?
Tests pragmatism over guesswork. A strong answer asks if this is a census or sample, population size, whether stratified or multi-group designs apply, and cost, time, and power constraints. Red flag: blurting a number without probing scope, design, or budget.
Are 1-5 satisfaction ratings continuous or discrete?
Tests knowledge of measurement scales. A strong answer calls 1-5 ratings discrete and ordinal, notes intervals may be unequal, and prefers medians or non-parametric tests over means unless equal spacing is defensible.
Explain what a p-value represents in an A/B test and interpret 0.03
This tests frequentist hypothesis testing literacy. It is the chance of seeing a result this extreme if the null of no effect were true; 0.03 means 3% chance of such data under the null, not 97% chance the variant wins. Red flag: saying 97% likely.
Mean, median, and mode: which measure for task completion times?
This tests whether you know task times are skewed and sample size drives the mean-versus-median choice. A strong answer cites the under-25 rule, contrasts mean outlier sensitivity with median robustness, and dismisses mode. Red flag: defaulting to the mean.
We are hiring for this. Every open role lists the topics its interview covers, so you can prepare for the real thing rather than guessing.
See open roles