Advanced concepts in DevOps & Cloud, page 7
IaC State: The Map Between Your Code and the Cloud
IaC state is the source of truth mapping your code to real-world resources, acting as your tool's memory. Terraform uses a state file to plan updates, while other tools use a service backend. The footgun: never commit state files to Git; they lack locking and.
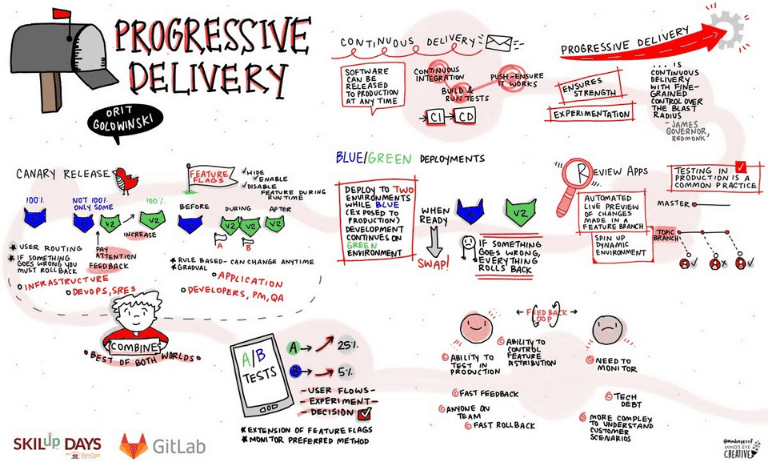
Progressive Delivery: Ship Faster by Reducing Blast Radius
Progressive Delivery reduces release risk by shipping to small user groups before a full rollout, like a soft-opening for new code. It uses canary releases and feature flags to catch issues before they impact everyone.
Resilience Engineering: Studying Success, Not Just Failure
Resilience Engineering studies how systems succeed despite surprises, not just why they fail. It applies to incident analysis and chaos engineering, focusing on building adaptive capacity for unknown events rather than just preventing known failure modes.
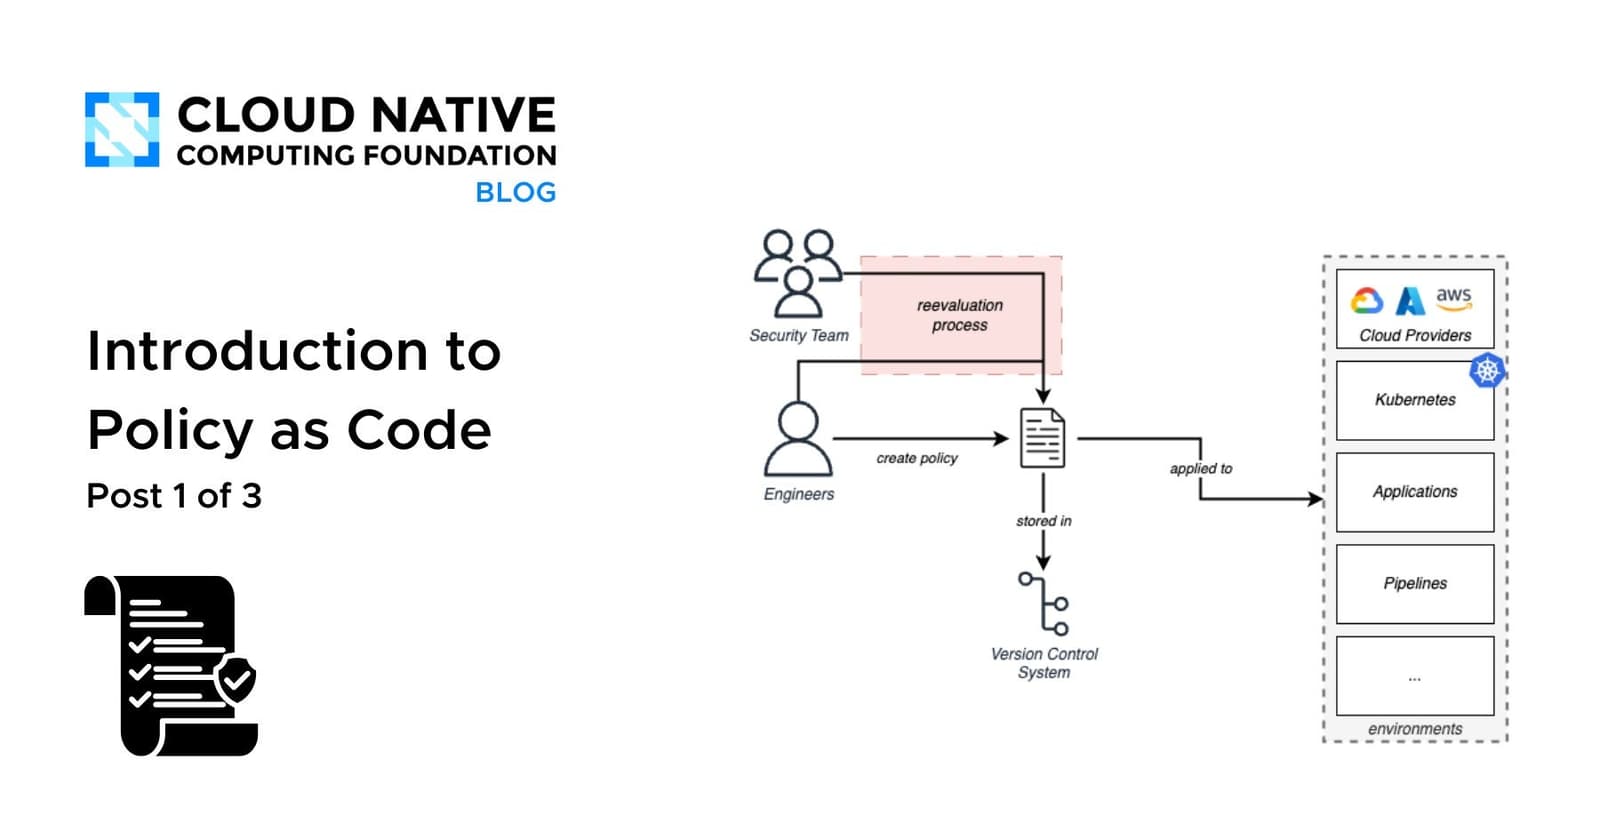
Policy as Code: Rules as Versioned, Testable Code
Policy as Code (PaC) treats rules like code: versioned, tested, and automated. Instead of manual UI clicks, you define guardrails in a declarative language. Use it in CI/CD to block bad deploys or in Kubernetes to enforce runtime rules.
Release Orchestration: Air Traffic Control for Deployments
Release Orchestration is the air traffic control for software delivery, coordinating multiple pipelines and teams. It's used for complex launches with interdependent services, ensuring everything deploys in the correct sequence.
Shift-Left Resilience: Chaos in Your CI/CD Pipeline
Think of it as an automated stress test in your build pipeline that breaks things on purpose. It runs alongside integration tests, injecting faults like pod failures to find weaknesses before a merge.
Environment Gating: Automated Go/No-Go for Deployments
Environment gating is an automated checklist for your CI/CD pipeline. Instead of just building code, it checks external signals like monitoring alerts or bug trackers before promoting a release.

PromQL: Querying Time Series Data as Vectors
PromQL treats metrics as vectors of values over time, letting you slice and aggregate system state. It's used for Grafana dashboards and Alertmanager rules. The footgun: applying rate() to a gauge instead of a counter produces silent, nonsensical results.
Just Culture: Fix the System, Not the Blame
Just Culture treats human error as a system failure, not a personal one. It's key for incident post-mortems, encouraging honest reporting to improve reliability.
Prometheus Alertmanager: Taming Your Alert Storms
Alertmanager is the traffic controller for your Prometheus alerts, turning a potential flood into actionable notifications. It groups, deduplicates, and routes alerts to services like PagerDuty. The footgun: don't load balance traffic to an HA cluster.
RASP: An Immune System for Your Application
Think of RASP as an application's immune system, using runtime instrumentation to block attacks from within. It provides real-time protection against threats that static analysis or network firewalls miss.
Customer Reliability Engineering: SRE for Your Customers
CRE extends SRE principles to your customers, making their reliability a shared goal. A provider partners with a key customer to co-engineer resilient services on their platform.
OpenTelemetry
OpenTelemetry is a CNCF standard for generating, collecting and exporting traces, metrics and logs from your services using one vendor neutral set of APIs and SDKs, so you can switch observability backends without rewriting instrumentation code.
CI/CD and the Principle of Least Privilege
Treat your CI/CD pipeline like a temporary worker, not a superuser. Grant it only the minimum permissions needed for its specific task, like building code or deploying to staging.
The Ironies of Automation: More Automation, More Problems?
Automating a system to reduce human error makes the human's role more critical, not less. The more reliable the automation, the less practice operators get for the rare, high-stakes moment it inevitably fails, leaving them unprepared to take control.

Service Mesh Observability: Seeing Inside the Black Box
A service mesh provides observability by intercepting all service-to-service traffic. It automatically generates logs, metrics, and traces, helping you debug distributed systems without changing application code.
Cost Anomaly Detection: Catching Runaway Cloud Bills
Think of cost anomaly detection as a fraud alert for your cloud bill. It uses machine learning to learn your normal spending patterns and automatically flags unexpected spikes before they become a crisis.
Cloud Unit Economics: Tying Spend to Value
Instead of just a total cloud bill, unit economics calculates cost per meaningful unit, like 'cost per customer.' This helps justify rising costs with business growth and lets product owners make data-driven pricing tradeoffs.
Helm Subcharts: Composing Applications from Dependencies
Helm subcharts are nested components a parent chart can configure, like a docker-compose for Kubernetes manifests. Use them to bundle dependencies like a database with your app. The footgun: subcharts are sandboxed and cannot access parent values directly.
Helm Hooks: Running Operations During a Release
Helm Hooks are Kubernetes resources that run at specific moments in a release lifecycle. Use them to run a database migration before an app upgrade or to back up data before a deletion. The footgun: a failing hook Job will block and fail the entire.
We are hiring for this. Every open role lists the topics its interview covers, so you can prepare for the real thing rather than guessing.
See open roles