Advanced everything in DevOps & Cloud, page 9
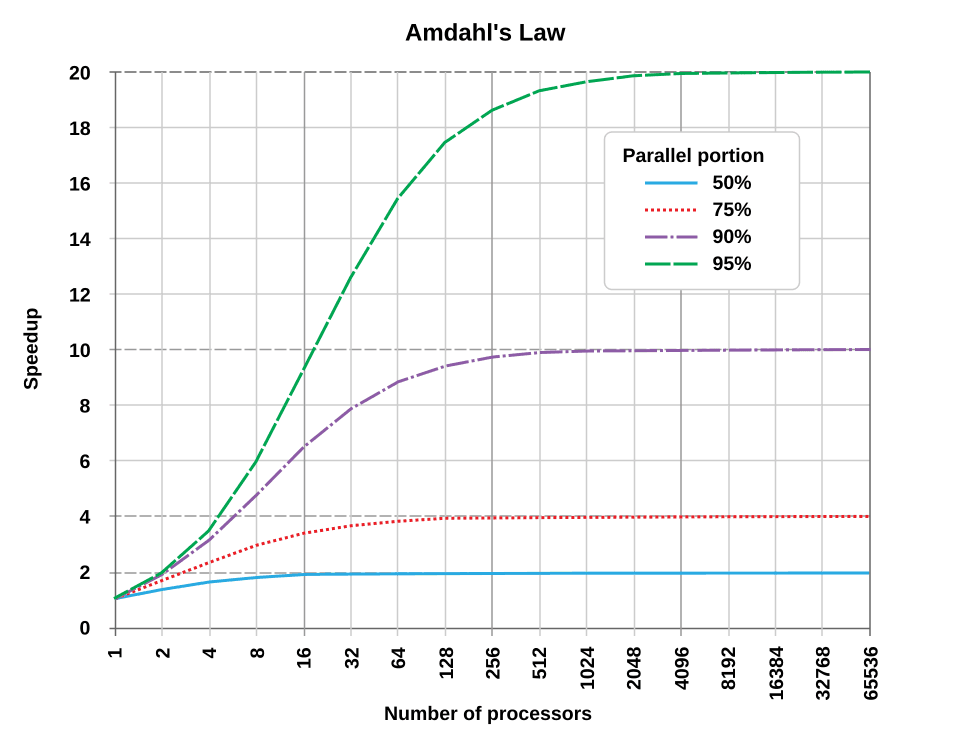
Amdahl's Law: The Bottleneck of Parallel Speedup
Amdahl's Law shows a system's speedup is limited by its sequential parts. If 10% of a task must run serially, your maximum speedup is 10x, no matter how many cores you add. This applies to CPUs, databases, and distributed jobs.
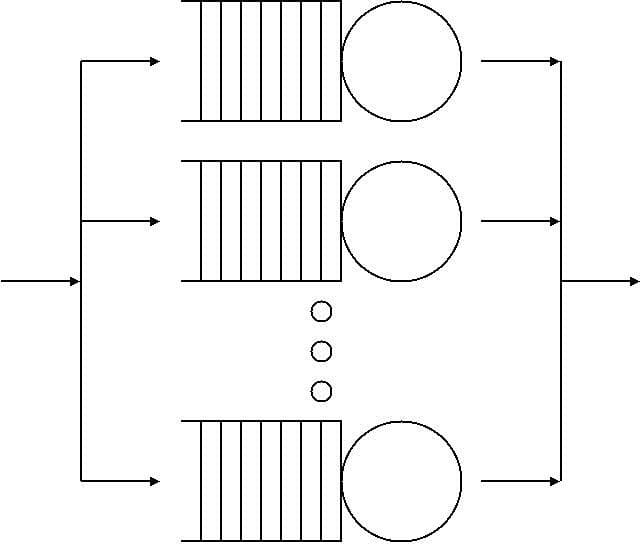
Queueing Theory: The Math of Waiting Lines
Queueing theory is the math of waiting lines, helping you predict system performance under load. It's used for capacity planning and setting autoscaling rules.

Critical Path Analysis for Performance Tuning
Critical path analysis finds the slowest chain of operations in a request, showing where to optimize for impact. Use it in distributed tracing to see which service call is the bottleneck. Optimizing off-path components is wasted effort.

Shadow Deployment: Test in Production, Safely
Shadow deployment copies live user traffic to a new "shadow" service for testing without user impact. It's used to validate new code versions with real-world load or to analyze traffic for security threats.
Continuous Deployment: Shipping Code on Every Commit
Continuous Deployment isn't just automation; it's shipping every merged change to production automatically. It's for teams with high test coverage and robust monitoring to reduce lead time.

Automated Canary Analysis: Let the Metrics Decide
Automated canary analysis uses metrics to decide if a new release is safe. It compares a new 'canary' version against the stable 'baseline' in production, scoring its health before a full rollout.
Auto-Remediation: Automated Fixes for Common Failures
Auto-remediation is a system's immune response, automatically detecting and fixing known problems like a crashed service. It's a core SRE practice for improving availability, but a bad script can create a 'remediation storm' that worsens an outage.
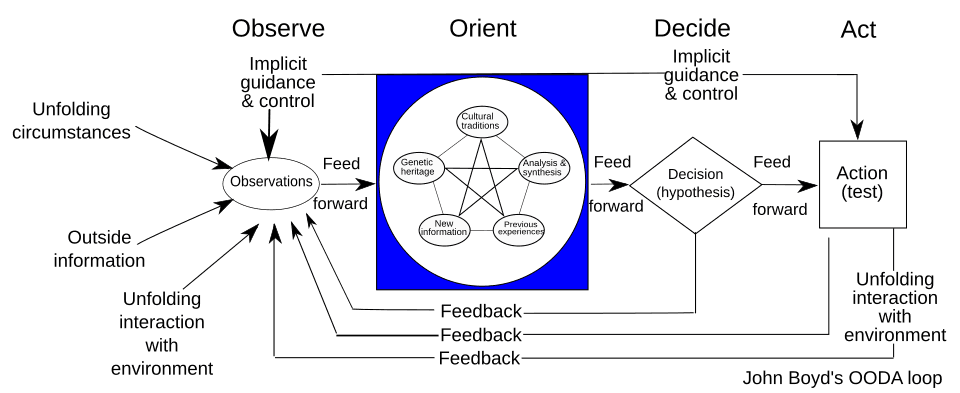
OODA Loop: Winning the Incident Response Race
The OODA loop (Observe, Orient, Decide, Act) is a model for making fast decisions under pressure. During an incident, the team that cycles fastest wins. It's used for triaging alerts and debugging live outages.
Game Days: Practice Breaking Your System Before It Breaks Itself
A Game Day is a live fire drill for your systems. You intentionally inject failure—like shutting down a service—to see how your team and automation respond, finding weaknesses before a real outage does.

Query Federation: Combining Prometheus Servers
Query federation lets one Prometheus server scrape metrics from another, creating a meta-monitor. Use it to build a global view from local servers or to combine application and infrastructure metrics for richer alerts.
Inverted Index: The Engine of Fast Log Search
An inverted index makes log search fast by mapping terms to the logs containing them, like a book's index. It powers platforms like Splunk or Elasticsearch, enabling instant searches across terabytes of data. The footgun is indexing high-cardinality fields.
Loki: The Log System That Indexes Labels, Not Text
Loki is a log system that indexes only metadata labels, not the full log content. This makes it cheaper and simpler to run than full-text indexing systems, storing compressed logs in object storage.
Prometheus Exemplars: Link Your Metrics to Traces
Exemplars are like footnotes for your metrics, linking a data point like a latency spike directly to a specific trace ID. This lets you jump from a 'what' on a dashboard to the 'why' in your tracing system.
Telemetry Processors: The Middle of the OTel Pipeline
A Telemetry Processor is a configurable stage in an OpenTelemetry Collector pipeline, sitting between data reception and export. You configure them in config.yaml to act on telemetry data.
Context Propagation: Stitching Microservices Together
Context propagation stitches a user request's journey across microservices by passing a shared ID. It's essential for distributed tracing, letting you see one request flow through many APIs.
Sampling: Tracing Everything Without Storing Everything
Sampling makes high-volume observability affordable by deciding which traces to keep and which to discard. It's essential in distributed systems where capturing every request is too costly.
Cardinality: The Hidden Cost of Time-Series Metrics
Cardinality is the number of unique label combinations in your metrics. High cardinality, from labels like user IDs, is the silent killer of monitoring systems like Prometheus, exploding memory and cost. The footgun is adding a label with unbounded values.
SRE Engagement Models: From Gatekeeper to Platform Builder
SRE engagement models define how reliability experts help product teams, evolving from gatekeeping existing services to providing reliable platforms. This applies when scaling an SRE team's impact.
Service Level Agreement (SLA): The Contract Behind Uptime
An SLA is a business contract, not a technical target. It defines the minimum service quality a provider promises a customer, with financial penalties for failure. You see them in every cloud provider contract.

Egress Gateway: Control Your Mesh's Outbound Traffic
An Egress Gateway is a monitored exit door for all outbound traffic from your service mesh. Use it to enforce security on external calls, like restricting domains or originating mTLS.
We are hiring for this. Every open role lists the topics its interview covers, so you can prepare for the real thing rather than guessing.
See open roles