Easy everything in DevOps & Cloud, page 8
APM: Turning System Metrics into Business Meaning
APM turns system metrics into business meaning by tracking software performance and availability. It matters most when slowdowns threaten service levels. The footgun is gathering data without translating IT metrics into what the business actually cares about.
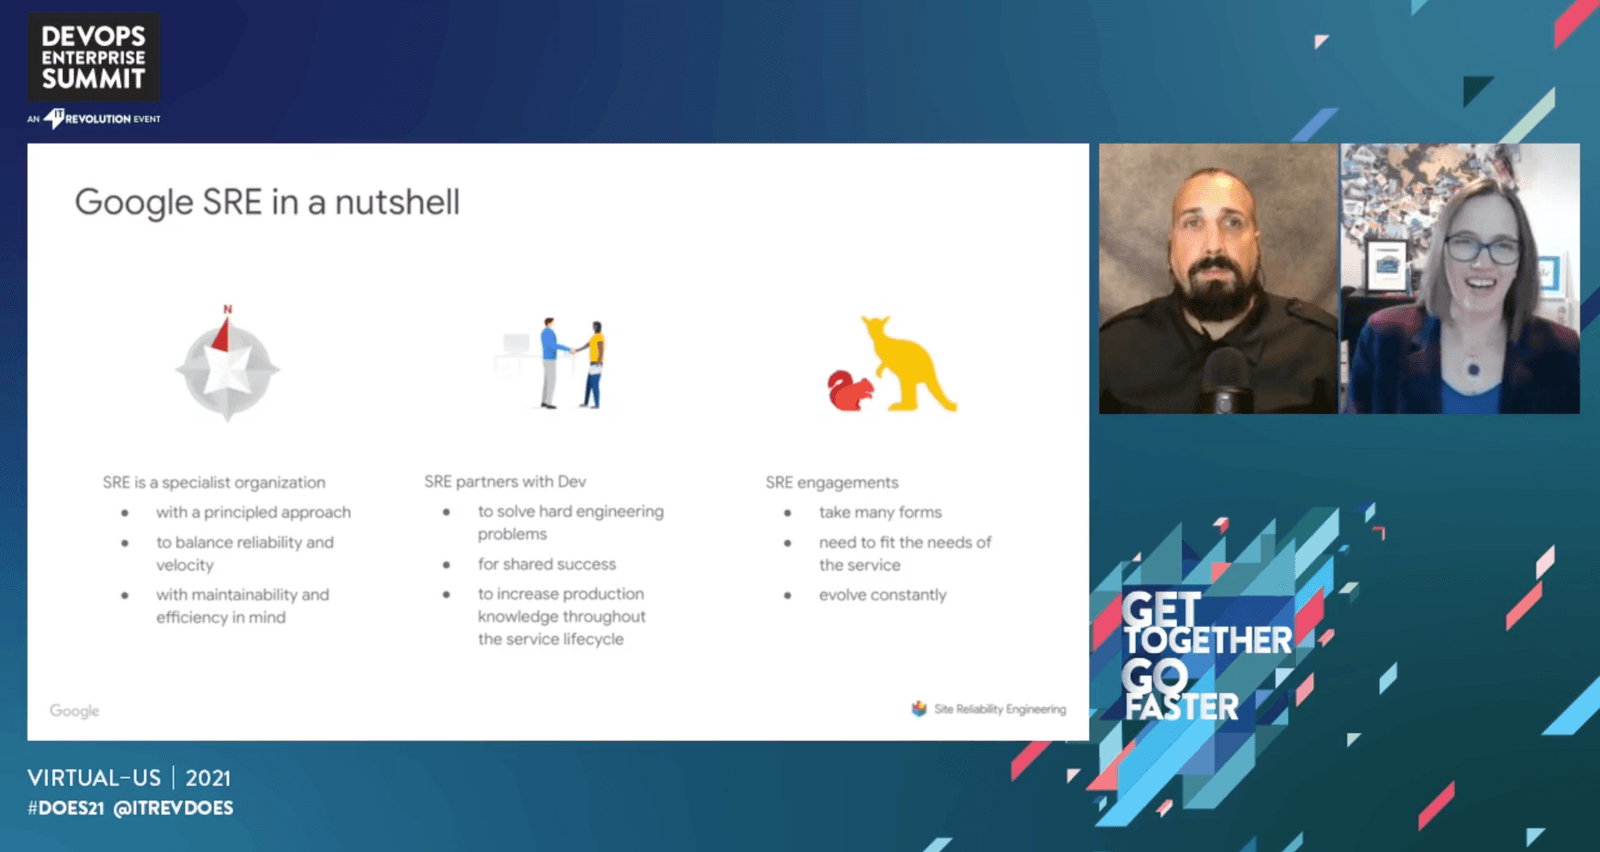
SRE Office Hours: Scaling Expertise Through Consultation
SRE Office Hours are a scheduled time for development teams to get expert advice from SREs, scaling reliability knowledge without embedding them everywhere. Use them to review designs or define SLOs. The footgun is treating them as on-call support.
The SRE Mandate: Breaking the Dev vs. Ops Cycle
SRE breaks the classic conflict between developers who want to ship fast and operations teams who want stability. It treats operations as a software problem, not a human one. The footgun is creating a rebranded sysadmin team that still does manual work.
Steady State Hypothesis: The Core of Chaos Engineering
The steady state hypothesis is the core of chaos engineering: you bet your system's key metrics won't change when you break something. It's used to test resilience by defining "normal" (e.g., latency <200ms) and then trying to disrupt it with faults.
Chaos Engineering: Finding Weaknesses Before They Find You
Chaos Engineering intentionally breaks parts of your system to find weaknesses before they cause real outages. It's used to test resilience against events like server crashes or network failures.
Horizontal Scaling: Add More Machines, Not Bigger Ones
Horizontal scaling (scaling out) means handling more load by adding more machines to your resource pool, not upgrading a single one. It’s used for web servers behind a load balancer. The footgun is that your app must be stateless to avoid losing user data.
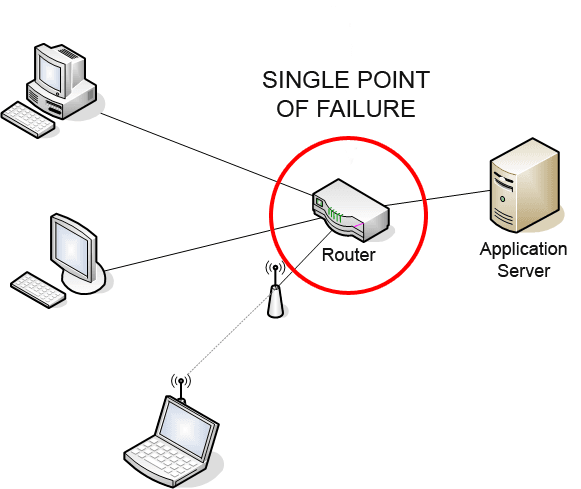
Single Point of Failure: Your System's Achilles' Heel
A single point of failure (SPOF) is your system's Achilles' heel—one component whose failure causes a total outage. This is critical in high-availability design, like ensuring a website survives a server crash. The footgun is missing implicit SPOFs.
Non-Functional Requirements: How a System Should Be, Not Just What It Does
Non-Functional Requirements (NFRs) define *how well* a system performs its tasks, not *what* tasks it performs. They're the adjectives (fast, secure, reliable) for a system's verbs.
Benchmarking: Know Your System's Limits
Benchmarking finds your system's limits by measuring its responsiveness and stability under a controlled workload. Use it to catch performance regressions, compare tech choices, or for capacity planning. The footgun: trusting benchmarks run on your laptop.
Stress Testing: Finding Your System's Breaking Point
Stress testing finds a system's breaking point by pushing it beyond normal limits. It's used for mission-critical software to test robustness and availability under extreme load, not just normal function.
Load Testing: Simulating Real-World User Traffic
Load testing answers 'Can our system handle expected traffic?' by simulating many users at once. Use it before a big launch to find bottlenecks. The footgun is confusing it with stress testing, which pushes a system past its limits to see how it breaks.

Release Candidate: The Final Dress Rehearsal
A Release Candidate (RC) is the final dress rehearsal before a software launch—a version believed to be stable enough to ship. It's used for final validation to catch show-stopping bugs.
CI/CD Pipeline: Automating Code from Commit to Production
A CI/CD pipeline is an automated assembly line for code, moving changes from commit to production. It automates building, testing, and deployment to increase release speed and find defects early.
Declarative vs. Imperative Automation
Declarative automation defines the desired end state (“what”), not the steps to get there (“how”). It's used in tools like Kubernetes to manage complex infrastructure, letting the system figure out the details.
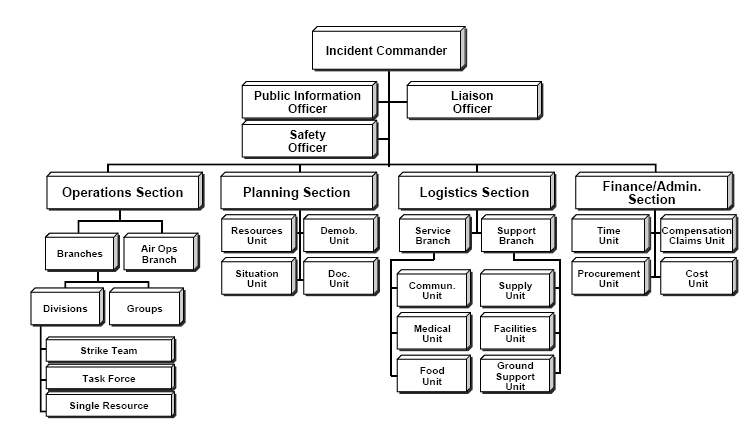
Incident Command System (ICS): Taming Outage Chaos
ICS gives a chaotic outage a clear command structure, defining roles so everyone knows who's in charge. It's used for major service outages or security breaches where multiple teams must coordinate. The footgun: not pre-assigning roles before a crisis hits.
The Incident Management Lifecycle
Incident management is a structured loop for handling service disruptions. It's not just about fixing the problem now, but identifying, analyzing, and correcting hazards to prevent them from happening again. The biggest mistake is skipping the 'prevent' step.

On-Call Management Platforms: Who Wakes Up?
An on-call platform is a smart switchboard for production alerts, ensuring the right engineer gets paged when things break. It connects monitoring tools to on-call schedules and escalation rules.
Incident Command: Who Does What in a Crisis
The Incident Command System (ICS) is a playbook for major outages, assigning clear roles to avoid chaos. It's like an emergency response crew for your software. Use it when multiple teams must coordinate.
On-Call Rotations: Engineering Reliability Under Pressure
On-call rotations are the human backstop for service reliability, with engineers responding to alerts in minutes. This is critical for high-availability services like search or email.
Grafana: Your Single Pane of Glass for Observability
Grafana is the universal dashboard for your system's health, visualizing metrics, logs, and traces from different sources in one place. Use it to monitor application performance and infrastructure health.
We are hiring for this. Every open role lists the topics its interview covers, so you can prepare for the real thing rather than guessing.
See open roles