Easy everything in Monitoring & SRE, page 3
Load Testing: Simulating Real-World User Traffic
Load testing answers 'Can our system handle expected traffic?' by simulating many users at once. Use it before a big launch to find bottlenecks. The footgun is confusing it with stress testing, which pushes a system past its limits to see how it breaks.

Release Candidate: The Final Dress Rehearsal
A Release Candidate (RC) is the final dress rehearsal before a software launch—a version believed to be stable enough to ship. It's used for final validation to catch show-stopping bugs.
CI/CD Pipeline: Automating Code from Commit to Production
A CI/CD pipeline is an automated assembly line for code, moving changes from commit to production. It automates building, testing, and deployment to increase release speed and find defects early.
Declarative vs. Imperative Automation
Declarative automation defines the desired end state (“what”), not the steps to get there (“how”). It's used in tools like Kubernetes to manage complex infrastructure, letting the system figure out the details.
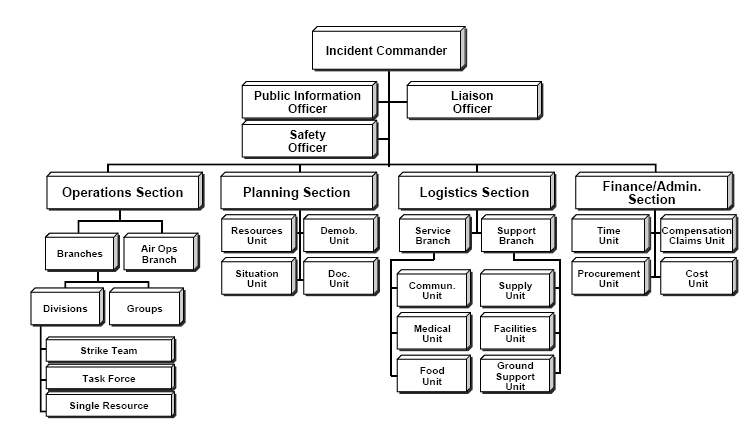
Incident Command System (ICS): Taming Outage Chaos
ICS gives a chaotic outage a clear command structure, defining roles so everyone knows who's in charge. It's used for major service outages or security breaches where multiple teams must coordinate. The footgun: not pre-assigning roles before a crisis hits.
The Incident Management Lifecycle
Incident management is a structured loop for handling service disruptions. It's not just about fixing the problem now, but identifying, analyzing, and correcting hazards to prevent them from happening again. The biggest mistake is skipping the 'prevent' step.

On-Call Management Platforms: Who Wakes Up?
An on-call platform is a smart switchboard for production alerts, ensuring the right engineer gets paged when things break. It connects monitoring tools to on-call schedules and escalation rules.
Incident Command: Who Does What in a Crisis
The Incident Command System (ICS) is a playbook for major outages, assigning clear roles to avoid chaos. It's like an emergency response crew for your software. Use it when multiple teams must coordinate.
On-Call Rotations: Engineering Reliability Under Pressure
On-call rotations are the human backstop for service reliability, with engineers responding to alerts in minutes. This is critical for high-availability services like search or email.
Grafana: Your Single Pane of Glass for Observability
Grafana is the universal dashboard for your system's health, visualizing metrics, logs, and traces from different sources in one place. Use it to monitor application performance and infrastructure health.

Prometheus: Monitoring with a Dimensional Data Model
Prometheus models system health as labeled time series, not just flat metrics. It pulls data from targets, making it ideal for dynamic cloud environments like Kubernetes. The footgun is using high-cardinality labels, which can overwhelm its storage.
Log Aggregation: Centralize Your System's Story
Log aggregation funnels scattered logs from many servers into one central, searchable system. It's crucial for debugging distributed systems where one request touches many services.
Time-Series Databases: Optimized for Data Over Time
A Time-Series Database (TSDB) is a database optimized for data where time is the primary key. It's the backbone for monitoring systems, IoT devices, and financial apps. The footgun is using a regular database, which can't handle the unique query load.
OpenTelemetry SDK: The Engine for Your Telemetry
The OpenTelemetry SDK is the engine that processes and exports your telemetry data. It implements the OTel API, letting you configure how traces and metrics are sampled, batched, and sent to a backend.
OpenTelemetry API: The Stable Interface for Your Code
The OpenTelemetry API provides stable interfaces for your code to generate telemetry. This lets you instrument your application once, while the SDK implementation handles the actual data processing and export, which can be swapped out later.
SLO Document: Your Service's Reliability Contract
An SLO document is the source of truth for a service's reliability promises, acting as a formal contract between teams on what 'good enough' looks like. It defines measurable targets for availability and latency, guiding engineering priorities.
SLO Time Windows: Choosing Your Measurement Period
An SLO's time window is the calendar for grading reliability. A short window forces rapid fixes, while a long one smooths out blips for strategic planning. The footgun is using calendar months, which have unequal lengths and complicate budget math.
Error Budgets: The Currency of Reliability
An error budget is the acceptable amount of downtime or errors your service can have over a period. Calculated as (1 - SLO), it's a currency for balancing risk (new features) and reliability work. The main footgun is treating it as a target to spend.
Health Checks: Is Your Service Alive or Just Running?
A health check answers 'Can you do your job?', not just 'Are you running?'. Load balancers and orchestrators use this API endpoint to stop routing traffic to sick instances.
Code Instrumentation: Making Your App Observable
Instrumentation is like adding a flight recorder to your app, emitting telemetry about its internal state. It's how you generate traces, metrics, and logs for observability tools. The main footgun is over-instrumenting, creating noisy and expensive data.
We are hiring for this. Every open role lists the topics its interview covers, so you can prepare for the real thing rather than guessing.
See open roles