Advanced everything in Product Management, page 5
Describe two methods for generating prediction intervals or probabilistic forecasts
Tests uncertainty quantification for risk-adjusted decisions. Strong answers: (1) parametric intervals via forecast error variance and normal multipliers, (2) bootstrap residual resampling for empirical percentiles.

Explain how CUPED increases statistical power and required data
Tests ANCOVA variance reduction. Answer: CUPED regresses pre-experiment X on Y, shrinking variance by (1-ρ²); needs pre-randomization prognostic baseline; beats difference scores. Red flag: calling it Y-X subtraction or saying it changes the effect.
Why is user-level randomization flawed by spillover and what is an alternative?
Network interference. A/B tests violate SUTVA when treatment spills across edges, biasing effects. Cluster randomization uses network clusters and Horvitz-Thompson weighting for unbiased estimates.
Why can't you t-test p99 latency, and what's a valid alternative?
Explain that t-tests target means while p99 variance depends on tail density; propose bootstrap CIs or permutation tests.

Describe data architecture for fast multi-dimensional slicing and pre-computation trade-offs
Tests analytical architecture trade-offs between latency and cost. Strong answers propose a hybrid pipeline: columnar warehouse for flexible exploration plus pre-aggregated OLAP cubes for sub-second dashboards.
How would you validate a feature's conversion impact given self-selection bias?
Tests causal inference for opt-in features. Strong answers use quasi-experiments like propensity matching or diff-in-diff to compare similar users and verify pre-trends. Red flag: a raw t-test between adopters and non-adopters ignoring selection bias.
How would you visually represent statistical uncertainty in a chart?
Awareness that plotted points are perceived as exact truths. Replace isolated bars with intervals showing point estimate uncertainty; add hypothetical outcome plots to make values tangible. Offering p-values or raw means without visualizing uncertainty range.
How do you build a performant visualization for millions of time-series points?
Tests end-to-end data reduction: backend bucket downsampling like LTTB preserves visual shape, frontend uses level-of-detail rendering and viewport culling. Red flag: naive every-Nth sampling that drops peaks or sending raw millions to the browser.

How do you manage event schema evolution without breaking reports?
Backward-compatible serialization, nullable new fields, raw versus modeled layers, versioned schemas, and consumer alerts.
What are the challenges of grouping by a high-cardinality dimension?
Tests columnar storage internals and query engine scalability. A strong answer covers memory pressure from giant hash tables, destroyed compression ratios, and massive result-set overhead.
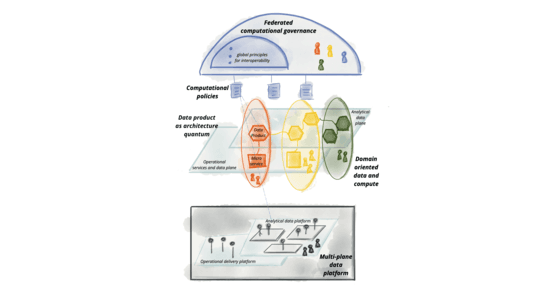
Design a scalable data governance framework balancing autonomy and control
Self-serve platform with domain products, auto-catalog, schema contracts, and policy-as-code access in CI/CD.
How do you root-cause bad data across microservices and Spark?
This tests structured debugging and observability for distributed pipelines. A strong answer isolates the break via lineage, validates schema and freshness per stage, and compares microservice outputs to Spark inputs.

Design a data quality framework from source to consumption
This tests full-lifecycle data architecture. Strong answers define ownership first, then schema contracts at ingestion, profiling and anomaly detection in CI/CD, column-level lineage, and KPI-linked scorecards. Red flag: tools before ownership or RACI.
Diagnose out-of-memory errors in a growing Spark job
Inspect plans for skewed partitions and joins; tune shuffle partitions, batch sizes, and join strategies; leverage AQE and statistics.

How do you guarantee at-least-once event delivery for a financial transaction?
Write events to a DB outbox in the same transaction as the biz update; a relay polls and publishes to analytics.

Design client-side event batching and prevent unload data loss
It tests balancing network efficiency and data reliability in browser analytics. Strong answers cover in-memory batching with size or time triggers, sendBeacon or fetch keepalive on visibilitychange, and a retry queue.

How do you measure data platform ROI and track it?
Cite adoption, time to insight, downtime cost, and cost per workload; then describe cost tags and usage telemetry.
How would you develop balanced KPIs for a two-sided marketplace?
Tests dual-sided metric design beyond B2C playbooks. Strong answers define buyer and seller liquidity separately, prioritize match rate over GMV, and monitor supply-demand balance granularly.
Ward Cunningham: Ship Early, But Repay Technical Debt
Ward Cunningham, who coined "technical debt," said shipping early to learn is like a loan: valuable only if you repay fast. Teams that never refactor see progress drop to zero as all effort goes to interest. Use debt to buy learning time, then refactor.
From Scrum Master to $200K AI Governance Officer
AI Governance roles hit $200K+, with Scrum Masters as top candidates under the EU AI Act. Like GDPR created the DPO, this mandates owners for AI inventory and risk, not lawyers.
We are hiring for this. Every open role lists the topics its interview covers, so you can prepare for the real thing rather than guessing.
See open roles