Intermediate everything in Product Management, page 18

Design a User Onboarding Funnel Analysis System
This tests translating a business need into a data model and query. First, define the cohort. Then, use CTEs to find the first timestamp for each event per user. Finally, count users at each step.

Implement an A/B test for a new checkout flow
Tests your grasp of the full A/B testing lifecycle. A great answer outlines a feature flag system, consistent user bucketing via hashing a stable user ID, and an analytics query grouping by variant. A red flag is suggesting simple client-side randomization.

How do you handle the multiple comparisons problem in A/B testing?
Tests your grasp of statistical risk in experimentation. Explain how multiple tests inflate false positives, then describe mitigations like Bonferroni correction or limiting concurrent tests. A red flag is suggesting total test isolation, which is impractical.

Visualize Correlation Between Load Time and Session Duration
Tests your ability to choose the right chart for correlation and layer in additional variables. A great answer starts with a scatter plot (load time vs. session duration), then uses color to represent the network type.
.png&w=1600&q=75)
Set up a cohort analysis for a new onboarding flow
This tests your ability to design a clean experiment to measure product impact. A great answer defines control/treatment cohorts by acquisition date (before/after Jan 1st), picks a specific metric like W1 retention, and compares them.

How to visualize a complex, multi-stage customer funnel?
Tests your ability to choose the right visualization for non-linear user flows. Propose a Sankey or Alluvial diagram to show flow volume, drop-off, and re-entry. A red flag is suggesting multiple simple charts that fail to show the paths between stages.
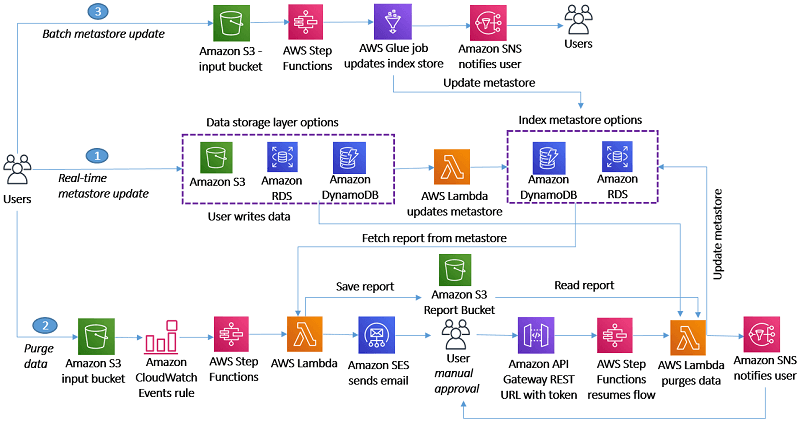
Enforce GDPR's Right to be Forgotten Across a Complex Architecture
This tests your design of a verifiable, async deletion workflow. A strong answer proposes a central index metastore, an orchestrated workflow (e.g., Step Functions) for deletion, and an auditing layer.
How would you design a 'button_click' analytics event payload?
This tests your ability to design for future analysis. A great answer specifies core identifiers (user ID, timestamp), contextual properties (page, component), and a flat JSON structure. A red flag is forgetting the user ID or providing an unstructured list.

Apply the AARRR framework to B2B SaaS vs. B2C mobile games
Tests translating the AARRR framework into concrete analytics for different business models. Define AARRR, then contrast B2B SaaS (account-level activation) with B2C games (user-level engagement). Red flag: using identical metric definitions for both contexts.
What is the difference between a metric and a KPI?
This tests your ability to connect technical measures to business outcomes. Define metrics as operational data and KPIs as the subset tied to critical goals.
Design a self-service analytics platform for non-technical users
Tests your ability to abstract SQL. A great answer outlines a semantic layer for virtual datasets, a no-code drag-and-drop UI, and a backend that translates UI state into SQL queries. A red flag is describing only a SQL editor, ignoring non-technical users.

Design an A/B Testing Framework
This tests your ability to design a scalable system with statistical rigor for non-experts. A great answer outlines config management, deterministic user hashing, a data pipeline for metrics, and a results UI that simplifies stats.
How would you design a data quality monitoring system?
This tests your systematic approach to data reliability. A strong answer defines quality dimensions (freshness, volume, schema), proposes specific checks, and outlines an alerting strategy. A red flag is listing checks without tying them to business impact.

Propose a technical architecture for a centralized Metrics Layer.
This tests your grasp of data governance and semantic layers. A great answer outlines a system with a central definition store (e.g., YAML in Git), a query engine, and an API, ensuring all teams get consistent metric results.

Design a data model for tracking feature adoption
This tests your grasp of data warehouse star schemas for analytics. Outline a fact table for events and dimension tables for users and features, explaining how this structure enables fast, ad-hoc cohort analysis for a product manager.

Explain cohort analysis and write a retention query
Tests your grasp of user behavior metrics. First, define a cohort (e.g., May signups). Then, explain why it's better than aggregate retention. Finally, outline a query grouping users by signup week and checking for activity. A red flag is a flawed query.
Explain event schemas and the purpose of a schema registry
Tests your grasp of data contracts at scale. A good answer defines schemas as contracts, a registry as the enforcer of compatibility (e.g., backward/forward), and explains how this prevents 'poison pill' messages and brittle analytics.
Design a Data Model for a Feature Adoption Dashboard
This tests your ability to translate a business need into a scalable star schema. A great answer defines a central fact table (e.g., fct_feature_usage) and its dimensions (dim_users, dim_features, dim_date).

Describe the role of dbt in a modern analytics stack
Tests your grasp of modern ELT patterns. A good answer explains how dbt uses SQL for in-warehouse transformations, enabling software engineering practices like version control and testing. A red flag is confusing dbt with a full ETL tool or an orchestrator.
How would you measure P95 latency by geographic region?
Tests your ability to translate a business need into a concrete observability implementation. A good answer involves instrumenting the API with a histogram metric, adding a region label via GeoIP, and querying with histogram_quantile.
We are hiring for this. Every open role lists the topics its interview covers, so you can prepare for the real thing rather than guessing.
See open roles