Intermediate everything in Product Management, page 19

Which model for forecasting with seasonality and trend?
This tests your knowledge of classical time series models. A good answer names Holt-Winters, explaining its level, trend, and seasonal components. It also discusses choosing between additive and multiplicative methods. A red flag is jumping to complex models.
Train-Test Split vs. Time-Series Cross-Validation
This tests your grasp of data leakage in temporal data. A good answer explains why random splits create lookahead bias, then details how rolling-origin validation respects time. A red flag is just describing methods without explaining *why* one is necessary.
Explain time series stationarity and how to achieve it
Tests your grasp of core time series assumptions. Define stationarity (constant mean/variance over time), explain why models need it for stable predictions, and name methods to test and achieve it. A red flag is just saying the data looks 'flat'.

Primary vs. Guardrail Metrics in Experiments
Tests your grasp of risk management in A/B testing. A great answer defines a primary metric as the goal and a guardrail as a 'do no harm' check. A feature ships only if the primary improves without hurting guardrails.
What is the novelty effect in experimentation?
This tests your grasp of temporary user behavior changes that can invalidate A/B tests. A strong answer defines the effect, explains how it inflates metrics, and suggests running tests longer or segmenting by user tenure. A red flag is ignoring mitigation.

Why is stopping an A/B test early problematic?
Tests understanding of the 'peeking problem' in A/B testing. A good answer defines peeking, explains how it inflates false positive rates, and contrasts it with waiting for a pre-determined sample size. A red flag is not explaining the statistical mechanism.

How do you determine sample size and duration for an A/B test?
This tests your grasp of statistical power and business trade-offs. A good answer defines the four inputs (baseline, MDE, significance, power) to calculate sample size, then uses traffic to find duration.

Explain Simpson's Paradox with a user engagement example
Tests if you see beyond aggregate data. Define the paradox, give a numerical example where a feature fails overall but wins in segments (e.g., new vs. returning users), and name the confounding variable. A vague definition without numbers is a red flag.
DAU dropped 10% overnight. Is this a significant change?
Tests your use of statistical hypothesis testing on business metrics. Outline the process: state a null hypothesis (no change), choose a Z-test, calculate the p-value, and compare to an alpha of 0.05. A red flag is guessing causes before proving significance.
Explain correlation vs. causation with a software example
This tests your critical thinking about data and ability to avoid logical fallacies. A good answer defines both terms, then gives a software example where a third, confounding variable (like traffic) is the true cause of two correlated metrics.
A/B test p-value is 0.08, PM wants to ship. What now?
Tests if you can translate statistical risk into business terms for a PM. A good answer defines the 8% false positive risk, weighs it against the cost of shipping, and suggests next steps like running the test longer instead of just saying no.
A/B Test Results with Skewed Traffic: What's Next?
This tests your ability to spot confounding variables. A good answer invalidates the results due to sampling bias, proposes segmenting the data by device to find the true effect, and suggests re-running the test with correct randomization.

How to query a monthly cohort retention table in SQL?
Tests your ability to translate a core business metric into a multi-step SQL query. A good answer finds each user's acquisition month, joins that back to their activity, and pivots the data into a cohort grid. A red flag is calculating aggregate retention.

Average latency is up 50ms, but p99 is flat. How do you diagnose this?
Tests your grasp of latency metrics. A rising average with flat p99 means the *bulk* of requests (p50-p90) slowed, not the tail. Hypothesize a common bottleneck and segment data by endpoint/user to find it. Red flag: blaming new, slow outliers.

Explain pre-attentive attributes in data visualization
Tests designing high-signal UIs. Define pre-attentive attributes as visual cues processed instantly (e.g., color, size, shape). Apply one to make key data 'pop' in a dense chart.
Stakeholder claims correlation implies causation. How do you investigate?
This tests your scientific rigor beyond the simple "correlation isn't causation" mantra. Acknowledge the finding, probe for confounding variables, suggest cohort analysis, and propose an A/B test. A red flag is reciting the mantra without a concrete plan.

How would you design a product management dashboard?
This tests your ability to structure data hierarchically for a specific persona (PM). A great answer outlines a 3-tier structure: summary KPIs, trend analysis, and drill-downs. A red flag is listing charts without explaining how they guide PM decisions.

How do you handle duplicate events in an analytics pipeline?
Tests your grasp of data integrity and idempotent processing. Explain how duplicates inflate COUNT(*), then propose adding a unique event_id and using a stateful stream processor to track seen IDs. Mention query-time COUNT(DISTINCT event_id) as an alternative.
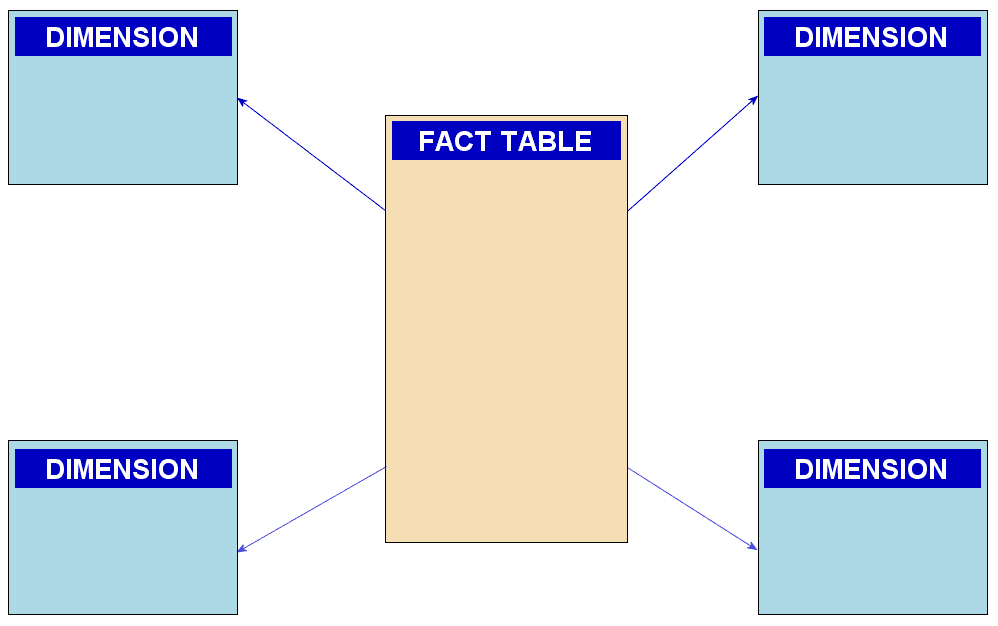
Explain the star schema and its advantages for analytics
This tests your grasp of OLAP vs. OLTP data modeling. A great answer defines fact/dimension tables, explains how denormalization leads to fewer joins and faster queries, and contrasts this with 3NF's focus on write integrity.
How to diagnose a slow dashboard query?
This tests systematic debugging of a data problem. A good answer investigates the query plan first, then the table's physical layout (partitioning/clustering), and finally the BI tool and warehouse load. A red flag is jumping to a solution without diagnosis.
We are hiring for this. Every open role lists the topics its interview covers, so you can prepare for the real thing rather than guessing.
See open roles