All bites
The whole library, newest first. Filter by what you are here for, or pick a topic if you already know.
4247 bites
Page 124

The Multiple Comparisons Problem
Running many statistical tests on one dataset is like buying many lottery tickets; your chance of a "winning" false positive increases with each test. This happens in A/B tests with many metrics.
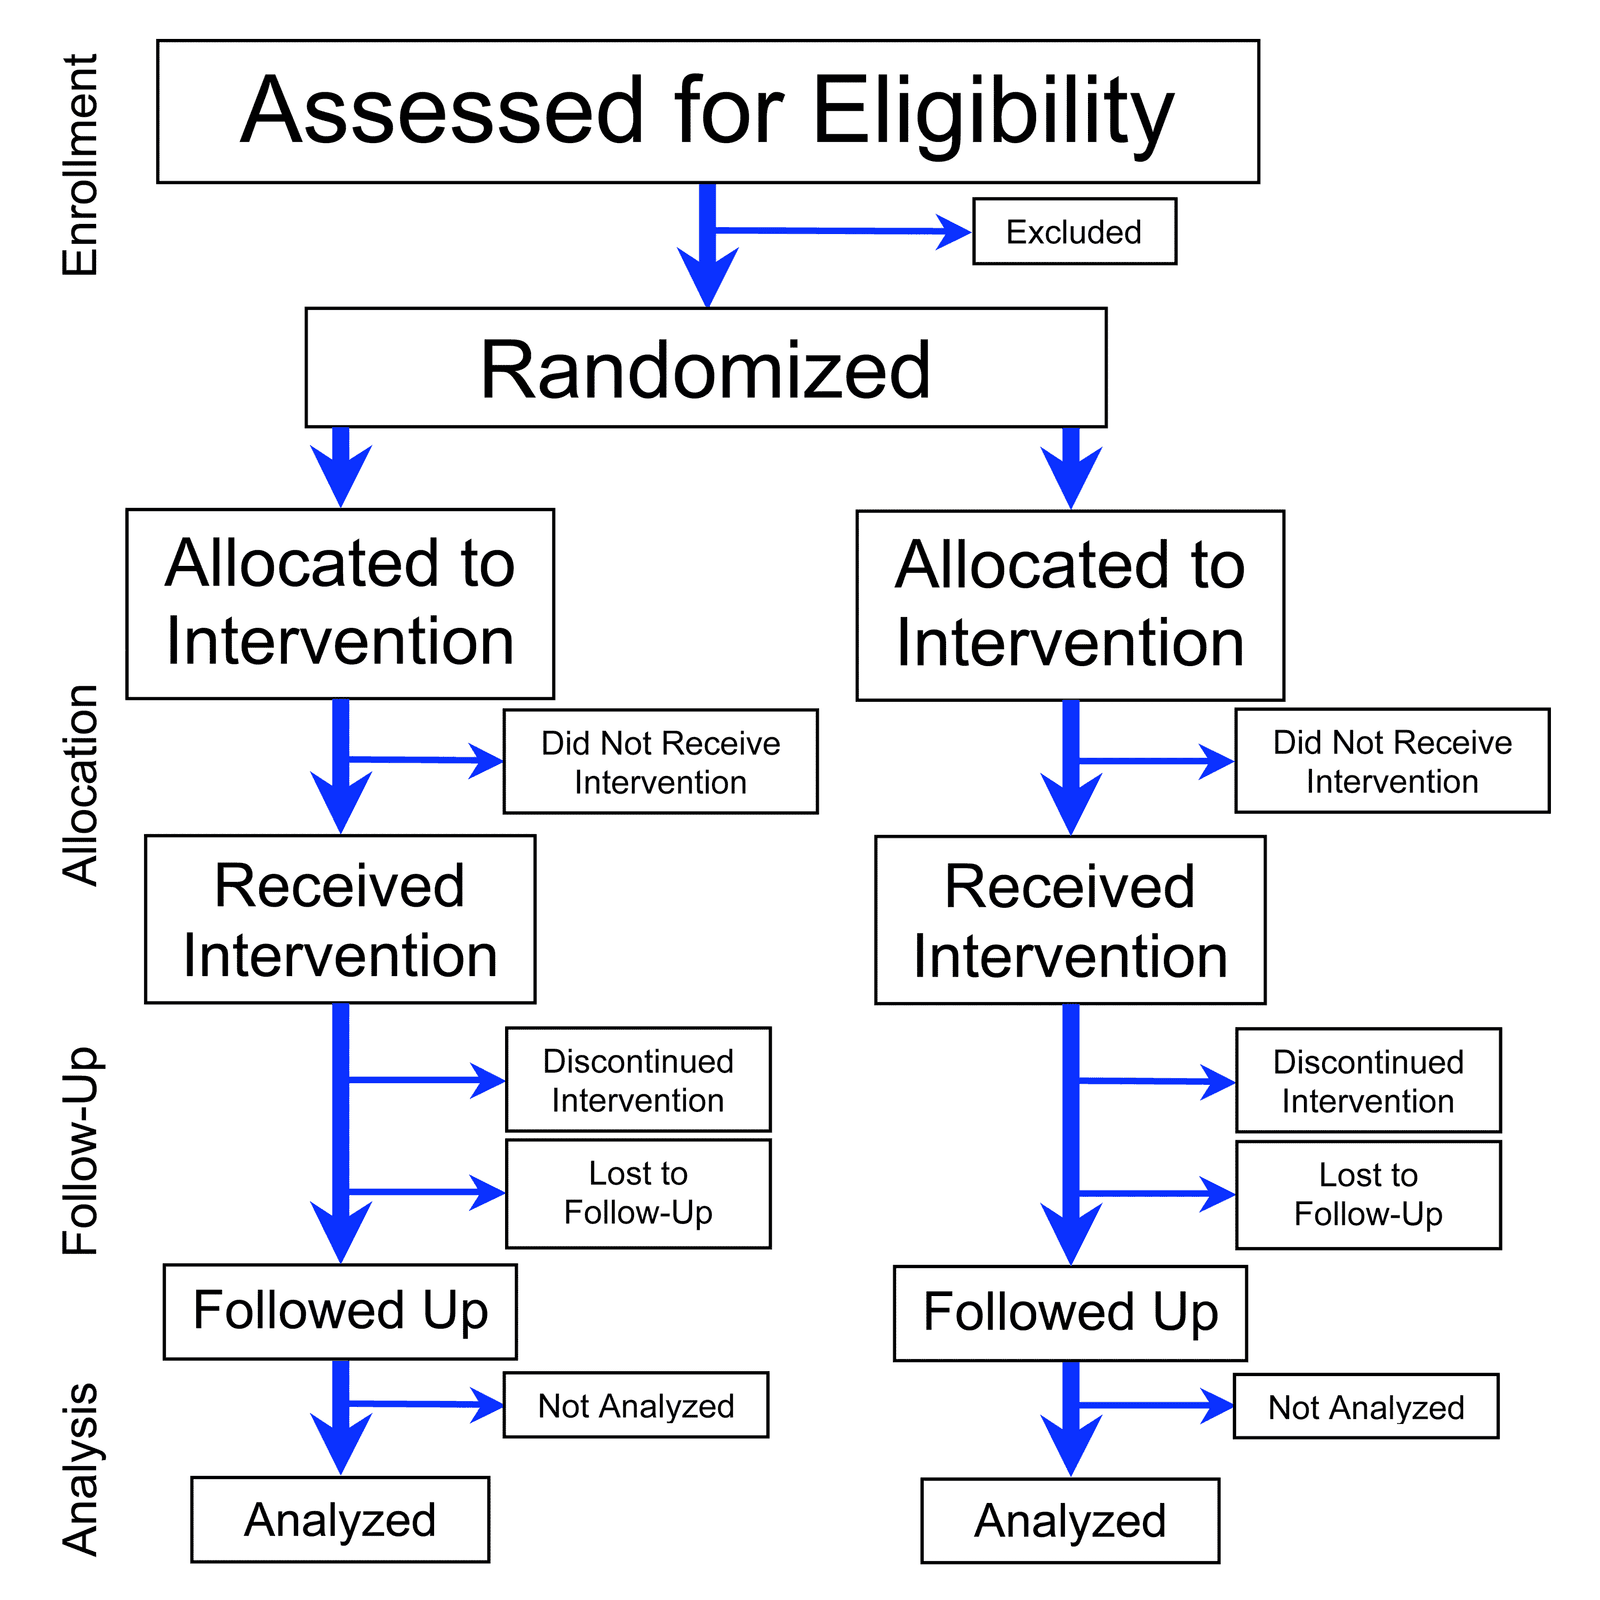
Randomized Controlled Trials: The Gold Standard for 'Did It Work?'
An RCT is a science fair experiment for business decisions, isolating one change to see its true effect. It's used in A/B tests to prove a new feature worked. The biggest footgun is peeking at results early, which can lead to false conclusions.
Selection Bias: When Your Sample Skews Your Results
Selection bias occurs when your data sample isn't random, leading to flawed conclusions. This happens when surveying only volunteers or analyzing a non-representative group. The footgun is assuming your data reflects the whole population when it doesn't.
Twyman's Law: Interesting Data is Usually Wrong
Twyman's Law states that any data point that looks interesting is probably wrong. Before celebrating a sudden 10x spike in user engagement, first suspect a bug in your analytics pipeline or a bot attack.
The Counterfactual Framework for Causal Inference
The Counterfactual Framework models causality by imagining two parallel universes for each person: one with a treatment, one without. It's the basis for A/B tests and analyzing observational data.
Average Treatment Effect (ATE): Isolating the Impact of a Change
The Average Treatment Effect (ATE) isolates an intervention's true impact by comparing the average outcome of a treated group to a control group. It's used in A/B tests and policy evaluations. The footgun is assuming causation without true randomization.

The Novelty Effect: When New Isn't Always Better
The Novelty Effect is a temporary metric spike from a feature's newness, not its inherent value. It often appears in A/B tests for high-frequency products, inflating short-term metrics. The footgun is mistaking this initial excitement for a long-term win.
Sample Ratio Mismatch (SRM): When Your A/B Test Is Broken
Sample Ratio Mismatch (SRM) means your A/B test's traffic split is broken, violating random assignment. For example, a 50/50 split results in a statistically significant imbalance.

Multi-Armed Bandit: The Explore vs. Exploit Trade-off
A multi-armed bandit algorithm balances exploring new options with exploiting the current winner, like a gambler trying slot machines to find the best payout.
Isolating Impact with Difference-in-Differences (DiD)
Difference-in-Differences (DiD) isolates an intervention's true effect by comparing a treatment group's change over time to a control group's. This reveals if a new feature truly boosted engagement, not just rode a general upward trend.
Regression Discontinuity Design (RDD)
RDD finds a natural experiment at a cutoff point, like a test score threshold for a scholarship. By comparing people just above and below the score, you can estimate the program's effect. The footgun is assuming this local effect applies to everyone.
Instrumental Variables: Isolating True Cause and Effect
Instrumental Variables (IV) isolate true causality when a key variable is tainted by hidden factors. An IV is a "clean" substitute that influences your cause without directly touching your effect, letting you measure the true relationship, free from…
Propensity Score Matching: Mimicking an A/B Test
Propensity Score Matching (PSM) mimics a randomized trial with observational data by finding a "statistical twin" for each subject. It's used to estimate a feature's impact when a true A/B test isn't possible. The footgun is assuming it removes all bias.

Moving Average: Smoothing Out the Noise in Data
A moving average smooths out noisy data by replacing each point with the average of its neighbors, revealing the underlying trend. It's used to track stock prices or server metrics without overreacting to short spikes.

Training vs. Test Sets: Judging a Forecast's True Accuracy
Don't judge a forecast by how well it fits the data it was trained on. To measure true accuracy, split your data into a training set for model fitting and a test set for evaluation, using data the model has never seen before.
Stationarity: A Time Series's Stable Personality
A time series is stationary if its statistical personality, like its average and spread, remains constant over time. Many forecasting models require this stability to work correctly.
Exponential Smoothing: Weighting Recent Data More Heavily
Exponential smoothing creates forecasts from a weighted average of past data, where weights decay exponentially for older points. It's used for quick, reliable predictions like inventory demand. The footgun: simple versions ignore trends and seasonality.
Holt-Winters Exponential Smoothing
Forecast time-series data by giving more weight to recent events. Holt-Winters smoothing is used to analyze metrics and make predictions by accounting for user-defined assumptions like seasonality.
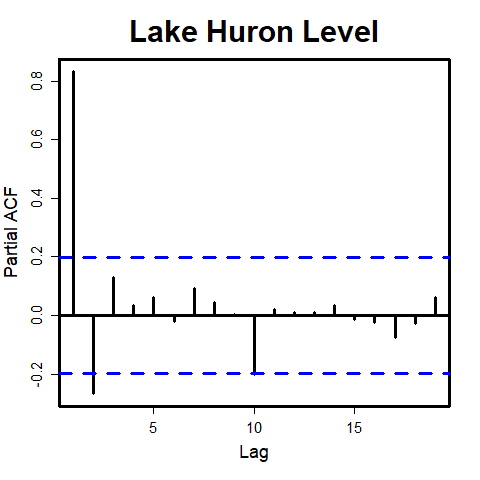
ACF vs. PACF: A Time Series Signal and Its Echo
Autocorrelation (ACF) measures a time series's total correlation with its past, including indirect echoes. Partial Autocorrelation (PACF) isolates the direct correlation by removing intermediate effects. They help select forecasting model parameters.
Time Series Cross-Validation
Unlike standard cross-validation that shuffles data, time series cross-validation respects the arrow of time. It evaluates a forecasting model by training only on past data to predict a future point, then rolling forward. The footgun is using random k-folds.