All bites
The whole library, newest first. Filter by what you are here for, or pick a topic if you already know.
4330 bites
Page 116

Generate a monthly cohort retention table from user events
This tests your ability to translate a business metric into a multi-step SQL query. A great answer defines cohorts by first activity, maps subsequent activity to period indices, counts distinct users, and pivots the result.

A/B test shows 5% lift with imbalanced mobile traffic. What next?
This tests sample ratio mismatch and Simpson's paradox. A strong answer says the lift is confounded by platform, demands stratified analysis to isolate the true effect, and checks randomization. A red flag is accepting the 5% lift without questioning skew.
A/B Test Results with Skewed Traffic: What's Next?
This tests your ability to spot confounding variables. A good answer invalidates the results due to sampling bias, proposes segmenting the data by device to find the true effect, and suggests re-running the test with correct randomization.
An A/B test has imbalanced traffic. What do you do?
This tests your ability to spot confounding variables and Simpson's Paradox. A good answer first invalidates the aggregate result, then proposes segmenting by device to salvage insights, and finally investigates the root cause.
How would you validate a feature's conversion impact given self-selection bias?
Tests causal inference for opt-in features. Strong answers use quasi-experiments like propensity matching or diff-in-diff to compare similar users and verify pre-trends. Red flag: a raw t-test between adopters and non-adopters ignoring selection bias.
How would you validate a feature's success, correcting for self-selection?
This tests your ability to separate correlation from causation. A great answer identifies self-selection bias, proposes a quasi-experimental method like Propensity Score Matching to create a control group, and then compares outcomes.
How would you validate a PM's claim about feature success?
This tests your grasp of causal inference vs. correlation. A great answer acknowledges self-selection bias, proposes a quasi-experimental method like Propensity Score Matching to create a synthetic control group, and then compares outcomes for the matched…

Describe data architecture for fast multi-dimensional slicing and pre-computation trade-offs
Tests analytical architecture trade-offs between latency and cost. Strong answers propose a hybrid pipeline: columnar warehouse for flexible exploration plus pre-aggregated OLAP cubes for sub-second dashboards.
Design a Fast, Multi-Dimensional Analytics Dashboard
This tests your grasp of data warehousing trade-offs for analytics. A great answer compares OLAP cubes (fast, pre-computed) vs. columnar DBs (flexible, real-time), then proposes a hybrid model.
How would you architect a fast, multi-dimensional analytics dashboard?
This tests your grasp of analytics architectures and trade-offs between pre-computation and real-time querying. A great answer clarifies needs, then proposes a hybrid model using an OLAP cube for core metrics and a columnar store for ad-hoc queries.
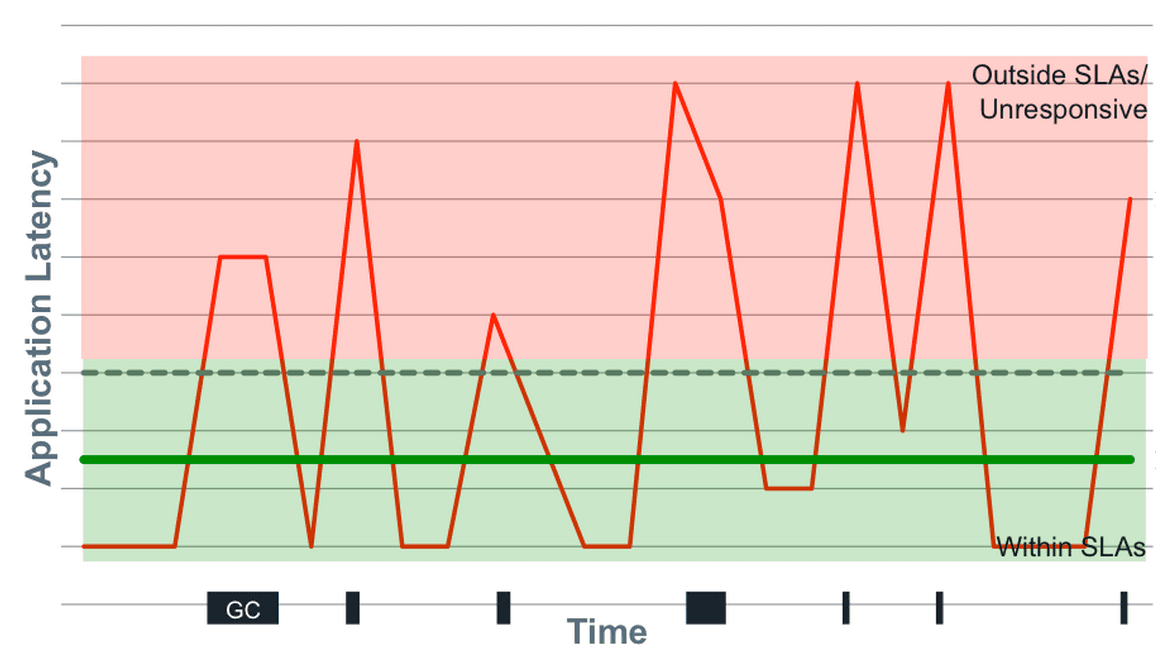
Mean or median for API response times?
Tests if you know latency is skewed and outlier-sensitive. Pick median over mean because hiccups distort the mean, but note median hides tail latency. Advocate for p95, p99, and max. Red flag: defending mean as representative or ignoring tail behavior.
Mean vs. Median for API Response Times?
Tests your understanding of non-normal distributions like latency. Choose median as it's robust to outliers that skew the mean. Then, state that even median is insufficient; percentiles (p99, max) are crucial for capturing the full user experience.
Mean vs. Median for API Response Times?
Tests if you know latency data has outliers. A good answer chooses median because it's robust to extremes. Explain that mean gets skewed by a few slow requests (e.g., GC pauses), hiding the typical user experience.
What does a p-value of 0.03 mean at alpha 0.05?
0.03 means 3% chance of data this extreme if the null (no effect) holds; since 0.03 < 0.05, reject the null.
What does a p-value of 0.03 mean in an A/B test?
This tests your grasp of statistical significance and ability to make a data-driven decision. A great answer defines p-value, compares it to alpha (0.03 < 0.05), and concludes to reject the null hypothesis. A red flag is misstating the p-value's definition.
What does a p-value of 0.03 mean in an A/B test?
Tests your practical statistical literacy. A good answer defines the p-value (3% chance of this result if the null is true), compares it to alpha (0.03 < 0.05) to reject the null, and decides to ship.
A/B test p-value 0.08, PM wants to ship. How do you advise?
Tests statistical rigor versus business pragmatism. A strong answer covers pre-registered thresholds, false positive risk, statistical power, confidence intervals, and the business cost of being wrong. Red flag: shipping without quantifying downside risk.
A/B test p-value is 0.08, PM wants to ship. What now?
Tests if you can translate statistical risk into business terms for a PM. A good answer defines the 8% false positive risk, weighs it against the cost of shipping, and suggests next steps like running the test longer instead of just saying no.
p-value is 0.08, significance is 0.05. Ship it?
This tests your ability to translate statistical risk for business partners. Explain that p=0.08 means an 8% chance of a false positive, quantify the cost of a bad decision, and suggest extending the test to increase power.
Explain the difference between correlation and causation with a software example.
Tests whether you distinguish association from causation to avoid blaming production issues. A strong answer defines both concepts, names a confounding variable, and gives a software example with a common cause. Red flag: claiming correlation is causation.