All bites
The whole library, newest first. Filter by what you are here for, or pick a topic if you already know.
4330 bites
Page 117
Explain correlation vs. causation with a software example
This tests your critical thinking about data and ability to avoid logical fallacies. A good answer defines both terms, then gives a software example where a third, confounding variable (like traffic) is the true cause of two correlated metrics.
Explain the difference between correlation and causation
Tests if you can avoid statistical fallacies. First, define correlation (association) and causation (cause-effect). Then, explain the difference via a confounding variable. A red flag is giving an example where one metric actually could cause the other.
Determine if a 10% DAU drop is statistically significant
Tests signal vs noise in stable metrics. Good answers define a null hypothesis, compute a test statistic from historical variance, compare to a critical value at set alpha, and check seasonality. Red flag: calling a large drop real without baseline variance.
DAU dropped 10% overnight. Is this a significant change?
Tests your use of statistical hypothesis testing on business metrics. Outline the process: state a null hypothesis (no change), choose a Z-test, calculate the p-value, and compare to an alpha of 0.05. A red flag is guessing causes before proving significance.
How to Statistically Test a 10% DAU Drop?
Tests your knowledge of hypothesis testing. A good answer outlines the steps: state a null hypothesis, choose a test (e.g., Z-test), calculate a p-value, and compare it to a significance level (alpha).

Explain Simpson's Paradox and construct a user engagement scenario
Tests whether you spot trends reversing when population mixes differ. Good answers define the paradox, give a numerical example with per-segment wins but aggregate loss, and warn against segment-only decisions.
Explain Simpson's Paradox with a user engagement example
Tests if you see beyond aggregate data. Define the paradox, give a numerical example where a feature fails overall but wins in segments (e.g., new vs. returning users), and name the confounding variable. A vague definition without numbers is a red flag.
Explain Simpson's Paradox with a user engagement example
This tests your understanding of statistical pitfalls in A/B testing. A good answer defines the paradox, gives an example where a feature fails in aggregate but wins in every segment, and attributes it to a confounding variable.
Why can't you t-test p99 latency, and what's a valid alternative?
Explain that t-tests target means while p99 variance depends on tail density; propose bootstrap CIs or permutation tests.
Why can't we t-test p99 latency in an A/B test?
This tests if you know why t-tests fail for percentiles. A t-test requires a normally distributed statistic (like the mean), but a sample p99's distribution isn't normal.
Why not t-test p99 latency? Describe a valid alternative.
This tests your grasp of statistical test assumptions. A good answer explains why p99 violates t-test normality, then outlines a resampling method like bootstrapping to build a confidence interval on the *difference* of p99s.

Design an A/B test for a 'Buy Now' button color change
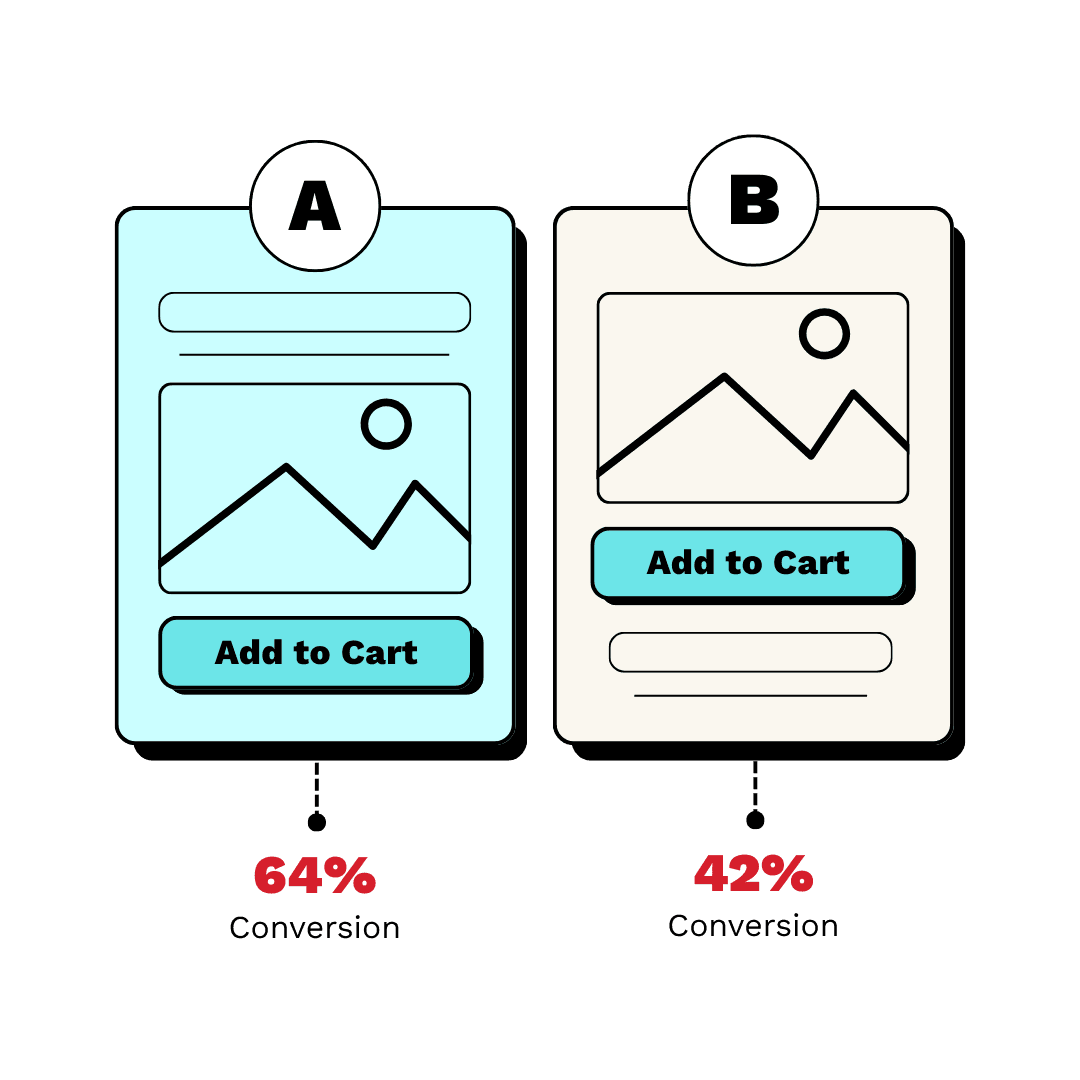
Tests structured experiment design from hypothesis to metric. Strong answers: define a falsifiable hypothesis; pick purchase conversion as primary; size the sample and duration; randomize by user; pre-commit to stopping rules.
How would you A/B test a 'Buy Now' button color change?
Tests your grasp of the A/B testing lifecycle. A strong answer defines a clear hypothesis (e.g., 'a green button will increase clicks'), selects a primary metric (CTR), and considers guardrail metrics. A red flag is skipping the hypothesis and metrics.
How would you A/B test a 'Buy Now' button color change?
This tests structured thinking. A good answer defines a hypothesis, selects primary and guardrail metrics, and outlines the experiment's duration and analysis plan. A red flag is focusing only on clicks without considering business impact.
How do you determine sample size and duration for an A/B test?
This tests statistical power literacy. A strong answer names baseline rate, MDE, alpha, and beta; explains the duration versus sensitivity trade-off; and notes traffic allocation. A red flag is ignoring power or stopping early when results look significant.
How do you determine sample size and duration for an A/B test?
This tests your grasp of statistical power and business trade-offs. A good answer defines the four inputs (baseline, MDE, significance, power) to calculate sample size, then uses traffic to find duration.
How do you determine A/B test sample size and duration?
This tests your ability to connect business goals to statistical parameters. A good answer defines the four power analysis inputs (baseline, MDE, alpha, power) and explains trade-offs, then converts sample size to duration using business cycles.

Why is stopping an A/B test at first significance problematic?
Tests peeking and Type I error inflation. Name peeking; explain daily looks inflate false positive rates above nominal alpha; note p-values assume one look at fixed sample size; recommend pre-committed runtimes or sequential testing.
Why is stopping an A/B test early problematic?
Tests understanding of the 'peeking problem' in A/B testing. A good answer defines peeking, explains how it inflates false positive rates, and contrasts it with waiting for a pre-determined sample size. A red flag is not explaining the statistical mechanism.
Why is stopping an A/B test when it hits significance problematic?
Tests your understanding of the 'peeking problem' in A/B testing. A great answer defines peeking, explains how it inflates the Type I error rate (false positives), and states the need for a predetermined sample size.