All bites
The whole library, newest first. Filter by what you are here for, or pick a topic if you already know.
8667 bites
Page 367
Hypothesis Testing: A Courtroom for Your Data
Hypothesis testing is a courtroom trial for a claim. You assume 'no effect' (the null hypothesis) and see if your data is strong enough to reject it. The footgun is misreading the p-value: it only measures evidence against the null, not for your alternative.
Linear Regression: Finding the Line of Best Fit
Linear regression draws the 'line of best fit' through your data to predict outcomes. It's used to estimate continuous values, like forecasting sales based on ad spend or predicting a house's price from its size. The main footgun: correlation is not causation.
Bayes' Theorem: Updating Beliefs with Evidence
Bayes' Theorem updates your belief in a cause after seeing new evidence. It's used in medical diagnostics to interpret test results and in spam filters. The common footgun is ignoring the base rate—how likely the cause was *before* the evidence appeared.

Vector Spaces: A Playground for Vectors
A vector space is a collection of vectors with strict rules for how they can be added or stretched. It's the foundation for linear algebra, used in graphics and physics. The footgun: not every set of vectors forms a valid space.

Probability Distributions: Mapping Odds to Outcomes
A probability distribution is a map of all possible outcomes and their chances. It's used to model everything from coin flips to customer churn. The footgun is assuming a simple bell curve when reality is often skewed or unpredictable.
Uplift Modeling: Who to Target, Not Just Who Will Convert
Uplift modeling finds who to target by predicting the *change* in behavior from an action, not just the final outcome. It's used in marketing to decide who gets a discount, optimizing spend. The footgun is confusing it with a simple conversion model.
Causal Inference: Proving Cause, Not Just Correlation
Causal inference goes beyond correlation to ask "did X *cause* Y?". It's used to prove a new feature drove engagement or a drug improved outcomes. The main footgun is mistaking association for causation, ignoring confounding variables.
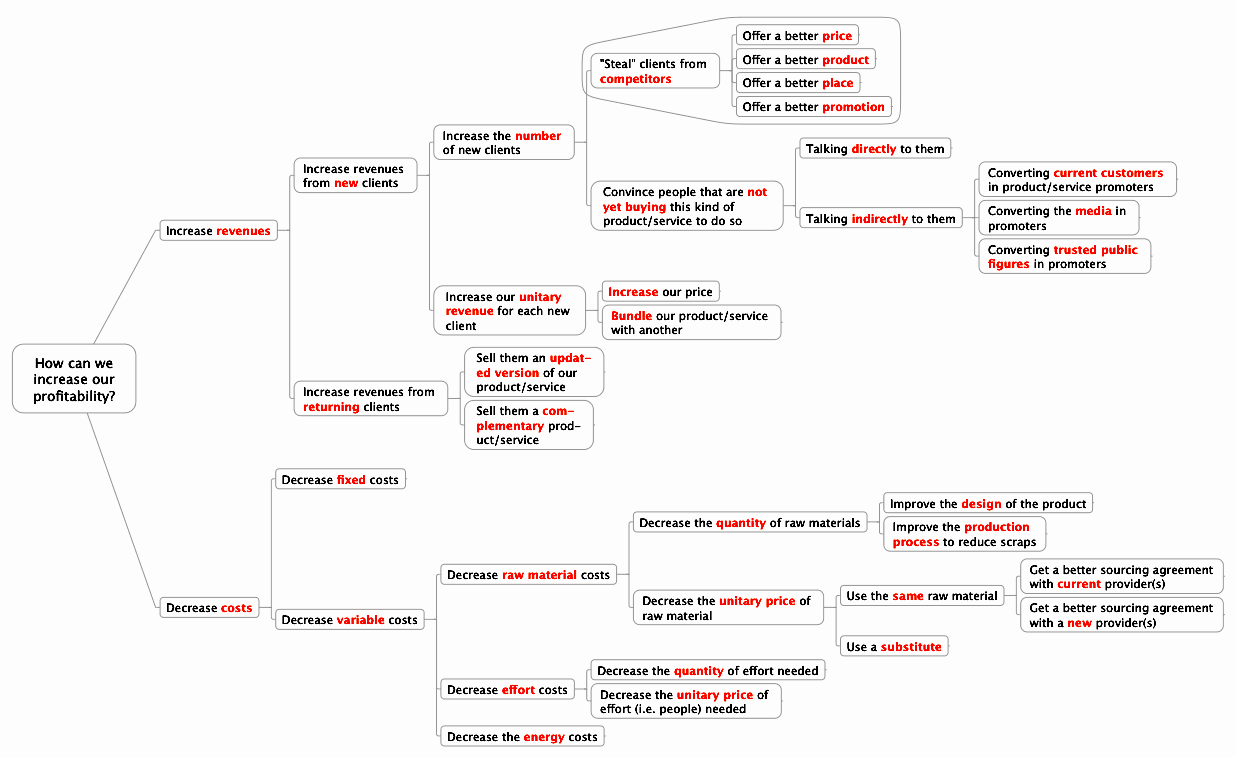
Issue Trees: Deconstruct Problems, Not Symptoms
An issue tree maps a problem's potential root causes. It's used in consulting and debugging to break down vague questions like 'Why is revenue down?' into testable hypotheses.

Leading vs. Lagging Indicators: Predict the Future or Report the Past?
Leading indicators are predictive inputs (like sales calls made) that forecast future results. Lagging indicators are outputs (like quarterly revenue) that report what already happened.

North Star Metric: Aligning Your Team With One Metric
A North Star Metric (NSM) is the single number that best captures the core value your product delivers, acting as a compass for your team. It aligns everyone on a shared goal, like Spotify using 'Time Spent Listening.' The biggest footgun is not having one.
Hypothesis-Driven Analysis: Ask First, Analyze Second
Start with a specific question, then use data to find a clear yes/no answer. This approach is perfect for A/B testing or diagnosing metric changes, but watch out for confirmation bias—seeking data that only proves your initial belief.
The MECE Principle: No Overlaps, No Gaps
The MECE principle structures analysis with 'no overlaps, no gaps.' Use it to break down problems, segment users, or plan projects. The footgun is achieving one rule (exclusive categories) but not the other (covering all cases), leading to flawed conclusions.
5 Whys: Find the Root Cause, Not the Symptom
The 5 Whys technique finds a problem's root cause by repeatedly asking "Why?" to trace a cause-and-effect chain. Use it in post-mortems to understand system failures. The footgun is blaming people instead of asking why the process allowed the error.
Stakeholder Analysis: Mapping Influence and Interest
Stakeholder analysis maps your project's human landscape, plotting who is affected (interest) and who can affect its outcome (influence). It's used to anticipate needs and align on goals.
Component Usage Guidelines: The Manual for Your Design System
Usage guidelines are the instruction manual for your design system, ensuring consistency. They prevent developers from guessing button states and designers from stretching logos.

Bundle Size: When Runtime Dependencies Defeat Tree Shaking
Tree Shaking is static, but your app is dynamic. It can fail when a component imports a large dependency for an optional, runtime-configured feature. A UI library's provider might pull in an entire form library, even if you don't use it.

Atomic CSS: Styling with Single-Purpose Utilities
Atomic CSS builds interfaces with tiny, single-purpose classes directly in your HTML, like using LEGO bricks for styling. It's the core of frameworks like Tailwind CSS, letting you build UIs without writing custom CSS. The footgun is creating unreadable HTML.
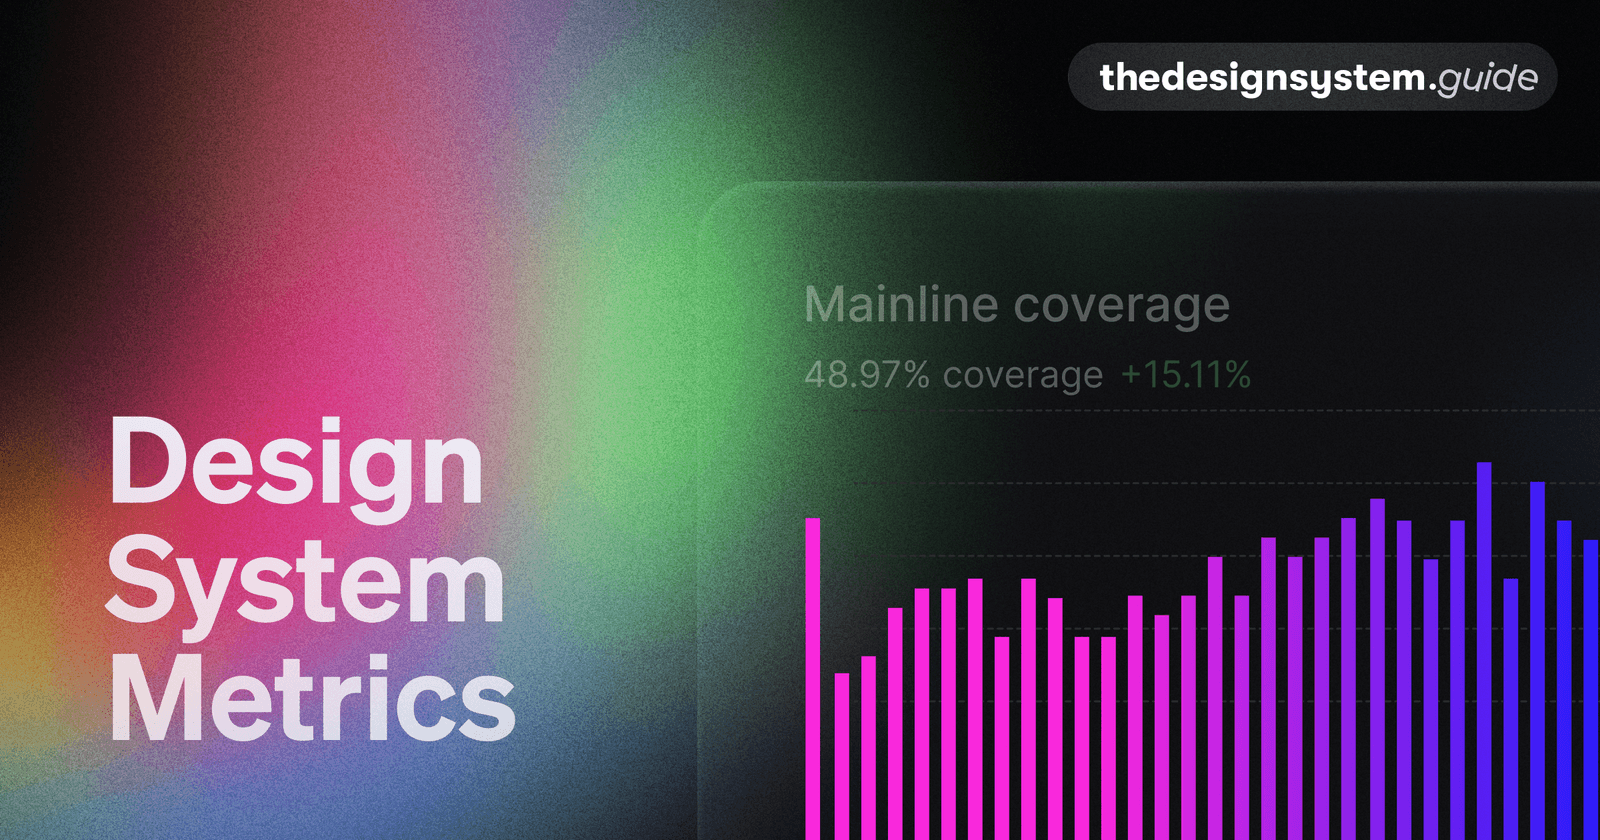
Design System Metrics: Proving Its Worth
Prove your design system's value with data, showing it's a force multiplier, not just a library. Track metrics like component adoption and faster time-to-market to justify budget and guide your roadmap. The footgun: avoid vanity metrics like component count.
Architectural Decision Records (ADRs): Documenting 'Why'
An ADR is a short text file capturing the 'why' behind a key engineering choice. Use it for big decisions like choosing a library or defining a core pattern.
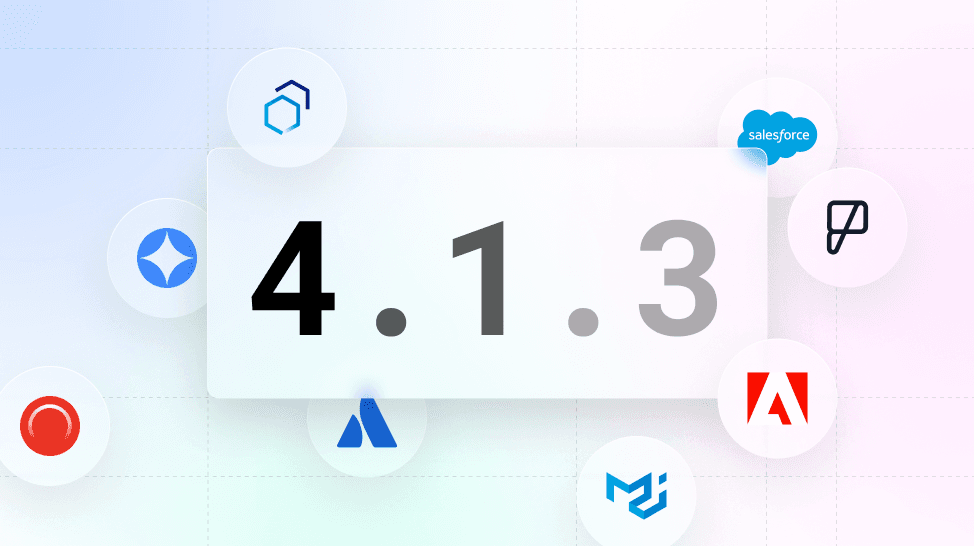
Versioning Design Systems: Holistic vs. Incremental
Versioning a design system is about communicating change. Use Semantic Versioning (MAJOR.MINOR.PATCH) to signal update impact. This prevents teams from using outdated components, ensuring consistency.