All bites
The whole library, newest first. Filter by what you are here for, or pick a topic if you already know.
8667 bites
Page 419
Instrumental Variables: Isolating True Cause and Effect
Instrumental Variables (IV) isolate true causality when a key variable is tainted by hidden factors. An IV is a "clean" substitute that influences your cause without directly touching your effect, letting you measure the true relationship, free from…
Regression Discontinuity Design (RDD)
RDD finds a natural experiment at a cutoff point, like a test score threshold for a scholarship. By comparing people just above and below the score, you can estimate the program's effect. The footgun is assuming this local effect applies to everyone.
Isolating Impact with Difference-in-Differences (DiD)
Difference-in-Differences (DiD) isolates an intervention's true effect by comparing a treatment group's change over time to a control group's. This reveals if a new feature truly boosted engagement, not just rode a general upward trend.

Multi-Armed Bandit: The Explore vs. Exploit Trade-off
A multi-armed bandit algorithm balances exploring new options with exploiting the current winner, like a gambler trying slot machines to find the best payout.
Sample Ratio Mismatch (SRM): When Your A/B Test Is Broken
Sample Ratio Mismatch (SRM) means your A/B test's traffic split is broken, violating random assignment. For example, a 50/50 split results in a statistically significant imbalance.

The Novelty Effect: When New Isn't Always Better
The Novelty Effect is a temporary metric spike from a feature's newness, not its inherent value. It often appears in A/B tests for high-frequency products, inflating short-term metrics. The footgun is mistaking this initial excitement for a long-term win.
Average Treatment Effect (ATE): Isolating the Impact of a Change
The Average Treatment Effect (ATE) isolates an intervention's true impact by comparing the average outcome of a treated group to a control group. It's used in A/B tests and policy evaluations. The footgun is assuming causation without true randomization.
The Counterfactual Framework for Causal Inference
The Counterfactual Framework models causality by imagining two parallel universes for each person: one with a treatment, one without. It's the basis for A/B tests and analyzing observational data.
Twyman's Law: Interesting Data is Usually Wrong
Twyman's Law states that any data point that looks interesting is probably wrong. Before celebrating a sudden 10x spike in user engagement, first suspect a bug in your analytics pipeline or a bot attack.
Selection Bias: When Your Sample Skews Your Results
Selection bias occurs when your data sample isn't random, leading to flawed conclusions. This happens when surveying only volunteers or analyzing a non-representative group. The footgun is assuming your data reflects the whole population when it doesn't.

The Multiple Comparisons Problem
Running many statistical tests on one dataset is like buying many lottery tickets; your chance of a "winning" false positive increases with each test. This happens in A/B tests with many metrics.
Bootstrapping: Quantifying Uncertainty with Resampling
Bootstrapping estimates uncertainty by resampling your own data. It's used to find confidence intervals for complex stats like medians where no simple formula exists. The footgun: it can't fix a biased sample, only reveal the uncertainty within it.
Statistical Power: Detecting Real Effects in Your Tests
Think of statistical power as your experiment's sensitivity. It's the probability of detecting a real effect, like a true lift in an A/B test. The main footgun is running a low-power test, which will likely miss a real improvement and lead you to discard good.
ANOVA: Comparing Group Averages by Analyzing Spread
ANOVA checks if group averages are different by comparing the spread *between* groups to the spread *within* them. It's used to see if three ad campaigns yield different click-through rates.
Bayesian Inference: Updating Beliefs with Data
Bayesian inference formalizes learning from experience, updating your belief in a hypothesis as you gather evidence. It's used in A/B testing and medical diagnostics. The footgun is that a poor initial belief (the prior) can skew your conclusions.

Standard Error: Gauging Your Measurement's Precision
Standard error measures the precision of a sample statistic, like the mean. It answers: "If I ran this experiment again, how much would my result change?" It's key for building confidence intervals and A/B testing. Don't confuse it with standard deviation.
Type I vs. Type II Errors: False Alarms vs. Missed Detections
A Type I error is a false alarm (a smoke alarm with no fire), while a Type II error is a missed detection (a fire with no alarm). This trade-off is crucial in A/B testing and medical diagnostics.

A/B Testing: Making Decisions with Data, Not Guesses
A/B testing is a controlled experiment pitting two versions of a product against each other with real users. It's used to see if a change, like a new button color, improves a metric like clicks.
Hypothesis Testing: Is Your Data Signal or Noise?
Hypothesis testing is a courtroom trial for your data: you assume a default 'null hypothesis' is true until your data provides enough evidence to reject it. It's used in A/B tests to validate changes.
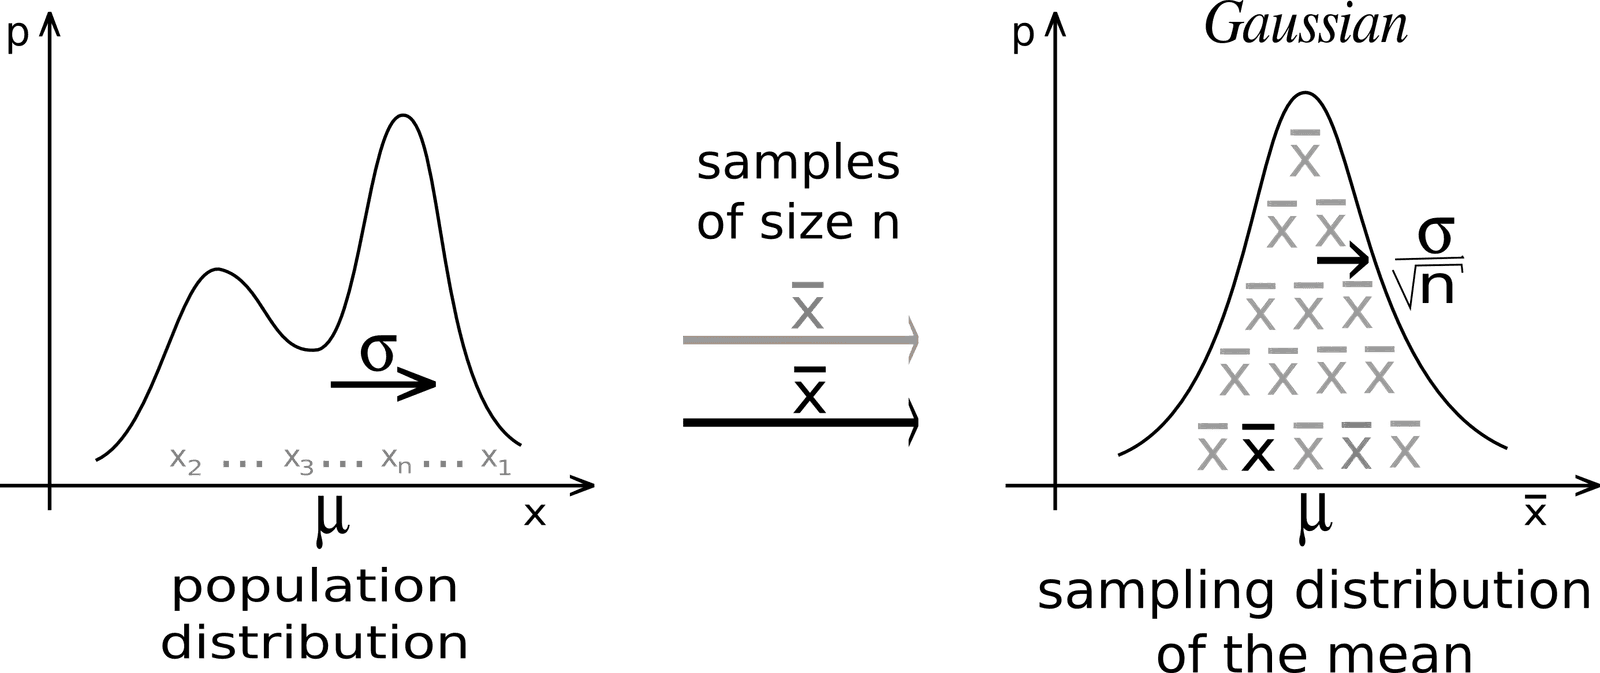
Central Limit Theorem: Why Averages Form a Bell Curve
The Central Limit Theorem explains why averages of samples tend to form a bell curve, even if the original data doesn't. It's the foundation for A/B testing and quality control. The footgun is assuming it works for small or non-independent samples.