Concepts in AI & ML, page 2

Activation Functions: Making Neural Networks Nonlinear
An activation function acts as a gatekeeper for a neuron, deciding what signal to pass on. It introduces non-linearity, allowing networks to learn complex patterns. A network with only linear activations collapses into a simple, less powerful model.
5 Whys: Find the Root Cause, Not the Symptom
The 5 Whys technique finds a problem's root cause by repeatedly asking "Why?" to trace a cause-and-effect chain. Use it in post-mortems to understand system failures. The footgun is blaming people instead of asking why the process allowed the error.

Pinhole Camera Model: Projecting 3D to 2D
The pinhole camera model is a simple formula for how a 3D world flattens into a 2D image. It's the basis for 3D reconstruction and augmented reality, relating an object's real-world position to its pixels.

Regularization: Penalizing Complexity to Prevent Overfitting
Regularization penalizes model complexity to prevent overfitting. It's used in training to help models generalize to new data, rather than just memorizing training examples. The footgun is applying too much, causing the model to become too simple and underfit.
The MECE Principle: No Overlaps, No Gaps
The MECE principle structures analysis with 'no overlaps, no gaps.' Use it to break down problems, segment users, or plan projects. The footgun is achieving one rule (exclusive categories) but not the other (covering all cases), leading to flawed conclusions.
RGB Color Model: Mixing Light, Not Paint
Think of RGB as mixing colored spotlights. Red, green, and blue light are added together to create the colors on your screen. The main footgun is confusing this with print's subtractive model, where mixing colors makes black, not white.
ML Experiment Tracking: Your Model's Lab Notebook
Think of it as a lab notebook for your models, logging every parameter and result. It's essential when tuning hyperparameters or comparing architectures, preventing you from losing track of what worked.
Hypothesis-Driven Analysis: Ask First, Analyze Second
Start with a specific question, then use data to find a clear yes/no answer. This approach is perfect for A/B testing or diagnosing metric changes, but watch out for confirmation bias—seeking data that only proves your initial belief.

Image Histograms: Visualizing an Image's Tonal DNA
An image histogram is a bar chart of an image's brightness, showing pixel counts from pure black to pure white. It's used in photo editing to instantly judge exposure, revealing clipped shadows or blown highlights.
Data Versioning: Git for Your Datasets
Think of data versioning as Git for datasets. It tracks changes to your data, allowing you to reproduce ML experiments or roll back to a previous state. The footgun is using regular Git, which chokes on the large binary files common in ML.
Word2Vec: Word Meaning as a Point in Space
Word2Vec turns words into numerical vectors, where semantic similarity becomes spatial proximity. It powers synonym detection and analogy tasks by learning from a word's context in a large text corpus.

North Star Metric: Aligning Your Team With One Metric
A North Star Metric (NSM) is the single number that best captures the core value your product delivers, acting as a compass for your team. It aligns everyone on a shared goal, like Spotify using 'Time Spent Listening.' The biggest footgun is not having one.
Camera Resectioning: Finding a Camera's Pose in 3D Space
Camera resectioning is like a detective's trick: use a photo of known objects to find the exact 3D position and orientation of the camera. It's key for AR and robotics. The footgun is assuming this finds all camera flaws; it only finds pose, not lens.
The Vanishing Gradient Problem
Training a deep network is like a game of telephone; the error signal (gradient) gets weaker as it's passed back through layers. This happens in deep networks using sigmoid or tanh activations.

Leading vs. Lagging Indicators: Predict the Future or Report the Past?
Leading indicators are predictive inputs (like sales calls made) that forecast future results. Lagging indicators are outputs (like quarterly revenue) that report what already happened.
Lens Distortion: Why Straight Lines Curve in Photos
Lens distortion makes straight lines appear curved in an image, a result of imperfect lens geometry. It's critical to correct in computer vision for tasks like 3D reconstruction, but is often ignored in regular photography.
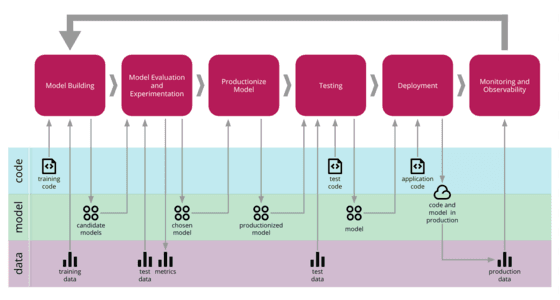
CD4ML: Automating ML from Data to Deployment
CD4ML extends CI/CD to manage ML's three axes of change: code, data, and models. It automates the entire lifecycle, enabling reliable updates for systems like sales forecasting.

LSTMs: Giving Neural Networks a Longer Memory
LSTMs give neural networks a longer memory, letting them connect events across long sequences. They excel at tasks like language translation or time-series analysis where distant context is key.
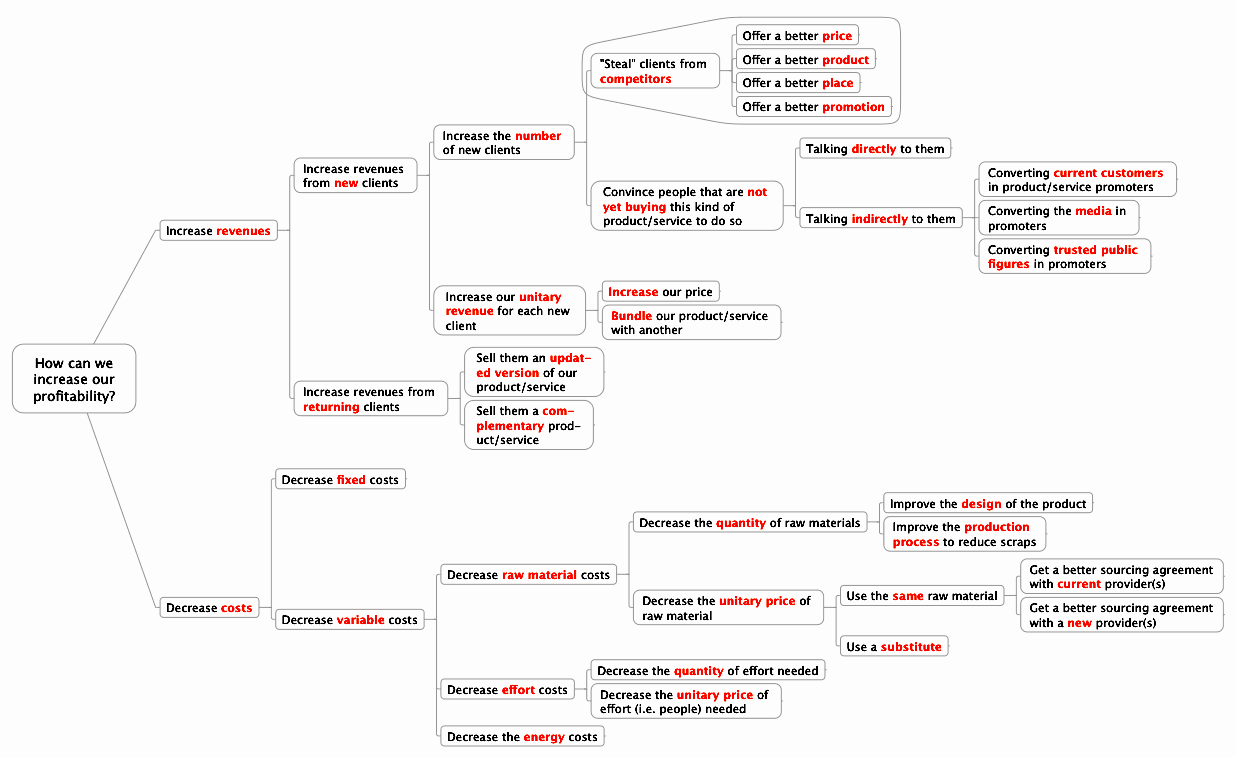
Issue Trees: Deconstruct Problems, Not Symptoms
An issue tree maps a problem's potential root causes. It's used in consulting and debugging to break down vague questions like 'Why is revenue down?' into testable hypotheses.

HSL and HSV: Intuitive Ways to Represent RGB Color
HSL and HSV are not new colors, but new ways to organize RGB. Think of them as cylindrical coordinates for color, making it easier for humans to select shades. You see them in every color picker.
We are hiring for this. Every open role lists the topics its interview covers, so you can prepare for the real thing rather than guessing.
See open roles