Concepts in AI & ML, page 6
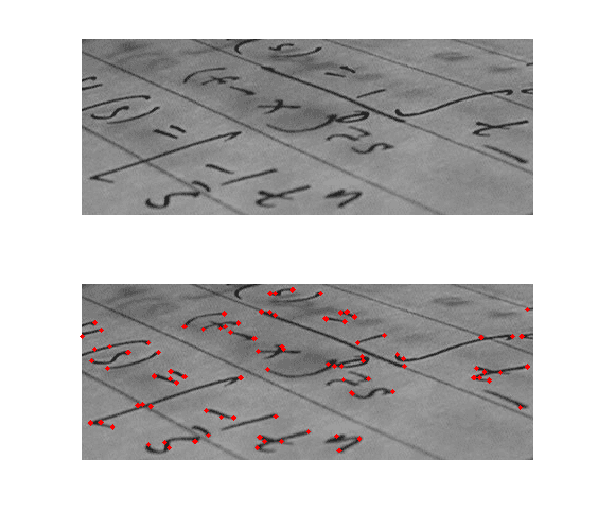
Corner Detection: Finding Stable Points in Images
Corner detection finds stable reference points in an image by looking for areas where pixel intensity changes sharply in multiple directions. It's used to track objects in video, stitch panoramas, and recognize objects by their features.
Feature Definition Language: Define ML Features as Code
A feature definition language is like infrastructure-as-code for ML features. It lets you define a feature's source and schema once, then use it for both offline training and online serving, ensuring consistency.

Tensor Parallelism: Split Layers, Not Just Models
Tensor Parallelism splits a single large model layer, like a weight matrix, across multiple GPUs to run in parallel. This is crucial for inference with models whose layers exceed a single GPU's VRAM.
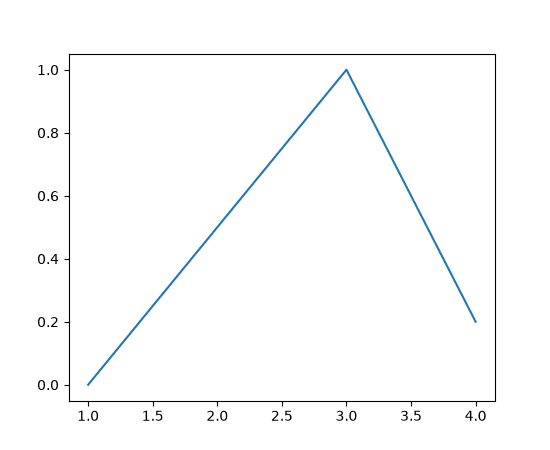
Matplotlib's Object-Oriented API: Explicit Plot Control
Instead of the stateful plt.plot(), Matplotlib's OO API gives you explicit control by creating Figure and Axes objects to call methods on, like ax.plot(). This is crucial for complex plots with multiple subplots. The footgun is mixing styles.
Hough Transform: Finding Shapes by Voting
The Hough Transform finds shapes by letting pixels "vote" for all lines or circles they could belong to. It's used to detect features like road lanes in noisy images.
Point-in-Time Correctness: Avoiding Data Leakage in ML
A point-in-time correct join is a time-traveling lookup for ML features, grabbing the most recent values known *at the time of an event*. It's vital when building training data from feature tables that update at different rates to prevent data leakage.
Prompt Engineering: Guiding LLMs to Better Answers
Prompt engineering means structuring instructions, context, constraints, and examples to make a model's output more useful for a task. For example, asking for JSON with a schema and one valid example can improve format consistency, but prompting alone cannot guarantee accuracy.
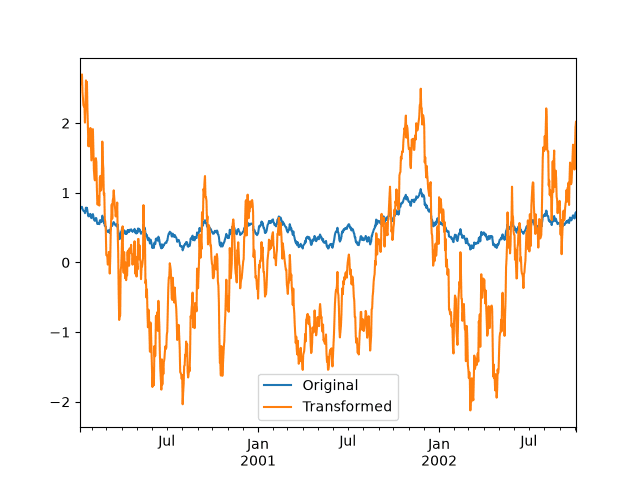
Groupby: The Split-Apply-Combine Strategy
Groupby operations let you split data into groups, apply a function to each, and combine the results. It's how you answer 'what's the average salary per department?' The footgun is using a slow custom .apply() function when a faster built-in method exists.
Scale-Space: Analyzing Images at Multiple Scales
Scale-space representation is like viewing an image from far away and up close simultaneously. It creates a stack of progressively blurred images to reveal structures at different sizes, which is key for robust feature detection.

Feature Governance: Taming Your ML Inputs
Feature governance treats ML inputs like code, enforcing consistency from training to production. It's a central system of record for what data your models see. This prevents training-serving skew.
Zero-Shot Prompting: Ask, Don't Show
Zero-shot prompting is asking an LLM to do a task without examples, relying on its pre-existing knowledge. Use it for simple tasks like basic translation or sentiment analysis where instructions are self-explanatory, but expect it to fail on complex tasks.
Scikit-learn's Universal API: Fit, Predict, Transform
The scikit-learn Estimator API is a universal contract: .fit() to learn, .predict() to guess, and .transform() to change data. It's used for everything from StandardScaler to RandomForestClassifier.
Difference of Gaussians: Finding Edges by Subtracting Blurs
Difference of Gaussians (DoG) finds features by subtracting a heavily blurred image from a lightly blurred one, isolating details at a specific scale. It's used for fast blob and edge detection.
Entity Embeddings: Smart Maps for Categorical Data
Entity embeddings turn categorical data like user IDs into dense vectors, creating a "map" where similar items are neighbors. This is used in neural networks to handle high-cardinality features efficiently, avoiding the memory bloat of one-hot encoding.
Tidy Data: One Variable, One Column
Tidy data is a standard for structuring datasets: each column is a variable, each row an observation. This format simplifies analysis, as tools can expect a consistent input shape.
FAST: High-Speed Corner Detection for Real-Time Vision
FAST finds corners by checking if a pixel is significantly brighter or darker than a ring of its neighbors. This simple, high-speed test makes it perfect for real-time video processing.
TensorBoard: The Dashboard for Your ML Model
TensorBoard is the dashboard for your ML model, showing what's happening inside during training. It tracks key metrics like loss and accuracy, visualizes the model's structure, and helps you debug performance. The main footgun is not logging the right data.

In-Context Learning: Teaching a GPT Without Retraining
In-context learning is like giving an LLM a cheat sheet in the prompt. You provide examples of a task, and the model follows the pattern for your new query without any permanent changes. Use it for one-off tasks like reformatting text or classifying sentiment.
ggplot2: Building Graphics with a Grammar
ggplot2 treats plots like sentences. You declare components—data, aesthetics (x/y axes, color), and geoms (points, bars)—and it assembles the visual. It's essential for data exploration in R, letting you iterate by swapping layers.
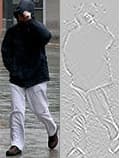
Histogram of Oriented Gradients (HOG)
HOG describes an object's shape by summarizing the directions of local intensity changes (gradients). It's a classic computer vision method for tasks like pedestrian detection where form matters more than color.
We are hiring for this. Every open role lists the topics its interview covers, so you can prepare for the real thing rather than guessing.
See open roles