Advanced interview questions in Analytics & Metrics, page 4
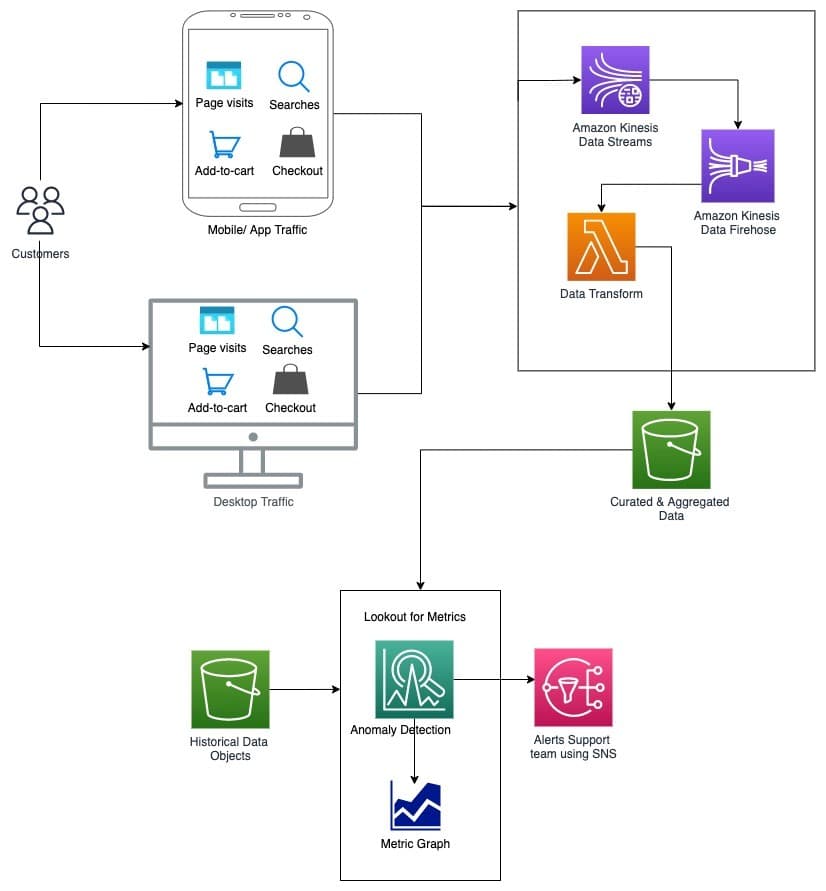
Design a system to detect sudden add-to-cart drops in real time
This tests streaming pipeline design and seasonality-aware anomaly detection. Outline Kafka or Kinesis ingestion, windowed aggregations, and ML baselines tuned to hourly and weekly trends. Red flag: static thresholds that ignore daily patterns.
Design a Real-Time Anomaly Detection System for E-commerce Events
This tests your ability to design a real-time data pipeline and apply ML to a business problem. Outline a streaming architecture (e.g., Kinesis), processing, and storage.
Design a real-time anomaly detection system for 'add to cart' events
Tests real-time data pipeline design and nuanced anomaly detection. A good answer outlines ingestion (Kinesis), processing (Lambda/Flink), seasonal modeling for 'a drop', and alerting (SNS).

Design an experiment and logging to link API latency to engagement
Causal inference and data integration. Randomly inject latency for a treatment group with a control at baseline, then join server trace IDs to client events via a shared request ID. Never confuse correlation with causation or miss join issues.
Correlate API Slowness with User Engagement
This tests your ability to design a controlled experiment and join disparate data. A good answer outlines an A/B test with an artificial delay, logging with shared IDs, and statistical analysis. A red flag is proposing a purely observational study.
Prove API Latency Affects User Engagement
This tests your ability to design a controlled experiment for a backend attribute. A great answer outlines an A/B test that artificially adds latency for a treatment group, details the necessary logging with shared IDs, and explains how to join and analyze…
How do you optimize a data warehouse for billions of rows?
Tests physical design in columnar warehouses at scale. Strong answers cover partition and cluster pruning, materialized views or rollups to reduce joins, caching and search indexes for hot paths, and reserved slots or autoscaling.
Optimizing a Slow, Expensive Data Warehouse for BI Dashboards
Tests your grasp of data warehouse architecture beyond basic SQL. A great answer covers partitioning/clustering, materialized views for pre-aggregation, and cost controls. A red flag is suggesting only query rewrites or just 'adding more compute'.
How would you optimize a slow, expensive data warehouse?
Tests your diagnostic approach to performance issues. A good answer first analyzes query patterns, then applies partitioning by date, clustering by high-cardinality keys, and materialized views for aggregations.
Design a near real-time pipeline to monitor orders per minute
Tests stream architecture and batch trade-offs. Outline: Kafka or Kinesis ingestion, Flink with tumbling windows, Druid or Pinot storage, Grafana alerts. Contrast batch on latency, exactly-once semantics, and cost. Red flag: calling cron SQL real-time.
Design a Near Real-Time Analytics Pipeline
Tests your ability to design a low-latency data system and articulate trade-offs. A good answer covers ingestion (Kafka), processing (Flink), storage (Druid), and visualization (Grafana), contrasting the architecture's low latency with a batch setup.
Design a near real-time analytics pipeline for a critical metric
This tests your grasp of stream processing trade-offs (latency, cost, correctness). Outline a 4-stage pipeline (ingest, process, store, visualize) with specific tech choices, contrasting its low-latency, high-cost nature with batch.
Design a real-time mobile analytics pipeline
Tests decoupling high-volume ingestion from low-latency querying. Strong designs use an event broker, a stream processor for windowed aggregates, and an OLAP database for sub-second dashboards.
Design a Real-Time Analytics Pipeline for Mobile Events
This tests your grasp of low-latency streaming architectures. A good answer outlines ingestion (SDK to Kafka/Kinesis), real-time processing (Flink/Spark), and sinking to a fast OLAP database (Druid/ClickHouse). A red flag is proposing a batch-based ETL design.
Design a Real-Time Analytics Pipeline for Mobile Events
Tests your grasp of low-latency, high-throughput design. A strong answer outlines ingestion (Kafka), stream processing (Flink), and a real-time OLAP database (Druid/ClickHouse). A red flag is proposing a slow, batch-only architecture.
Design an A/B test separating novelty from true long-term impact
Tests distinguishing novelty from stable effects. Strong answer: staggered rollout with difference-in-differences comparing early and late adopters over weeks. Red flag: extending the A/B test without modeling time-interaction or control maturation.
Design an experiment to isolate long-term impact from novelty effect
Tests if you can design experiments for long-term impact, not just short-term lift. A good answer involves a long-running test, segmenting users by tenure, and modeling the effect over time to find its stable asymptote.
How do you measure impact while accounting for the novelty effect?
Tests your ability to design experiments that isolate long-term effects. A good answer proposes a long-running A/B test, analyzing user cohorts by join date to see if initial lift decays. A red flag is ignoring the novelty effect and suggesting a short test.

How do you root-cause a 20% revenue drop with no pipeline failures?
Reconcile against raw events, slice by dimension for silent gaps, audit schema drift.
A key metric dropped 20%. How would you investigate?
This tests systematic diagnosis of critical issues. A great answer segments the drop (by region, platform), then traces data upstream from the dashboard to the source, correlating with technical metrics. A red flag is jumping to code before scoping the impact.
We are hiring for this. Every open role lists the topics its interview covers, so you can prepare for the real thing rather than guessing.
See open roles