Advanced everything in Analytics & Metrics
Diagnosing model degradation over time
Name it model drift, split data vs concept drift; diagnose by comparing distributions and ruling out pipeline bugs; fix via monitoring and retraining.
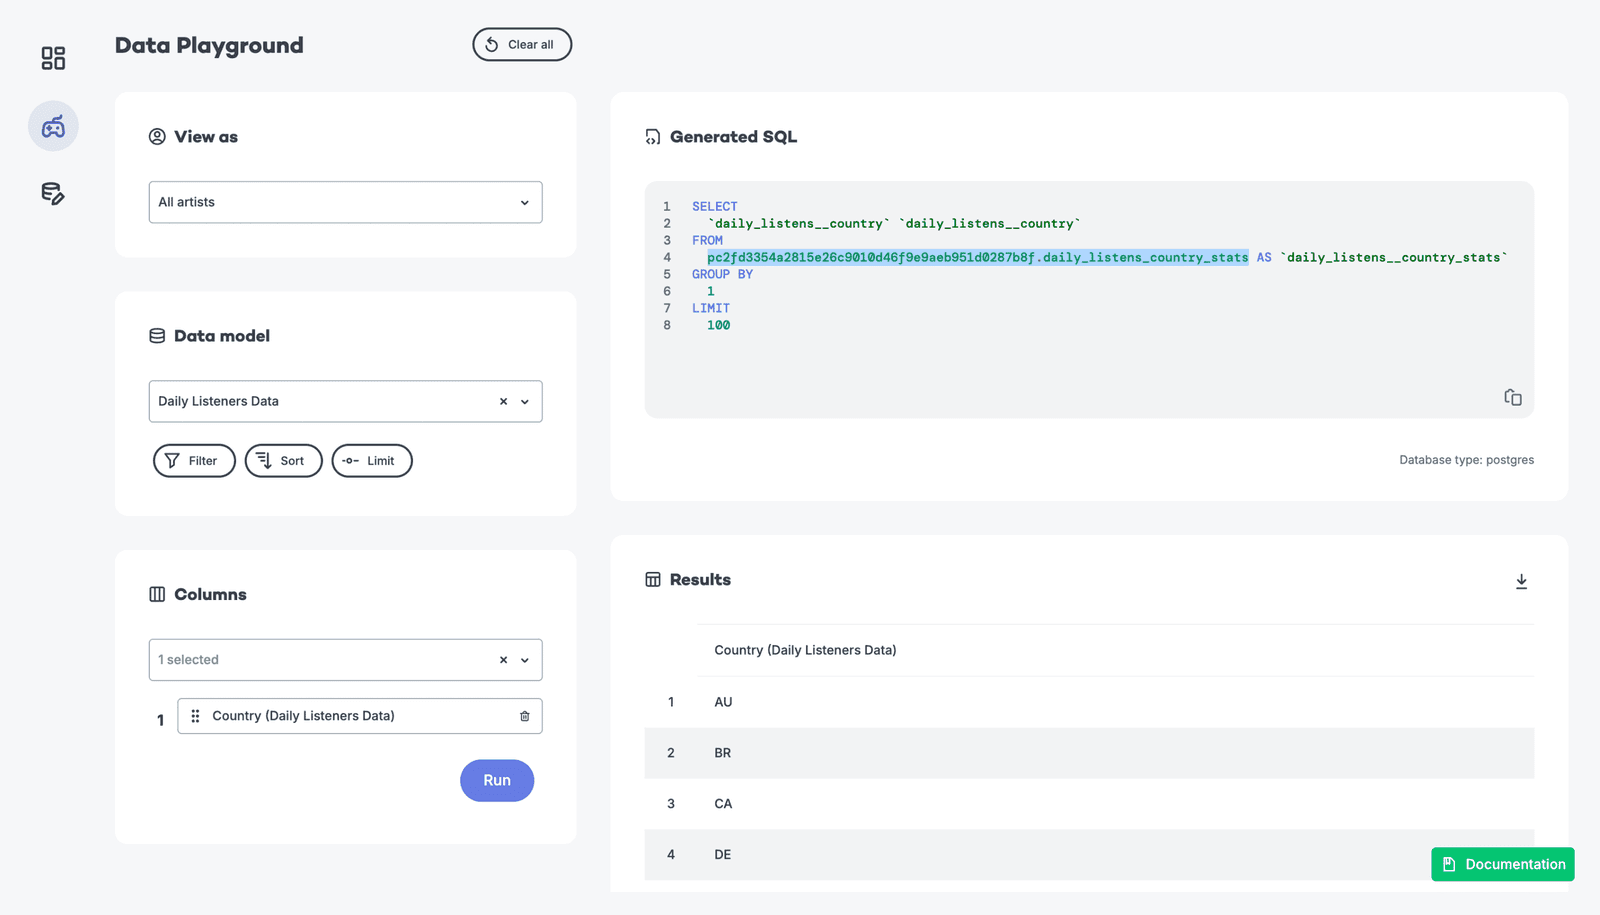
Trade-offs between pre-aggregated and raw event data for dashboards
Pre-aggregations trade freshness for speed; raw queries preserve flexibility but spike cost and latency under load.
Design column-level data lineage from source to dashboard
Propose AST extractors for Spark and dbt, a graph DB for column edges, and an API for impact analysis.

How do you root-cause a 20% revenue drop with no pipeline failures?
Reconcile against raw events, slice by dimension for silent gaps, audit schema drift.
Design an A/B test separating novelty from true long-term impact
Tests distinguishing novelty from stable effects. Strong answer: staggered rollout with difference-in-differences comparing early and late adopters over weeks. Red flag: extending the A/B test without modeling time-interaction or control maturation.
Design a real-time mobile analytics pipeline
Tests decoupling high-volume ingestion from low-latency querying. Strong designs use an event broker, a stream processor for windowed aggregates, and an OLAP database for sub-second dashboards.
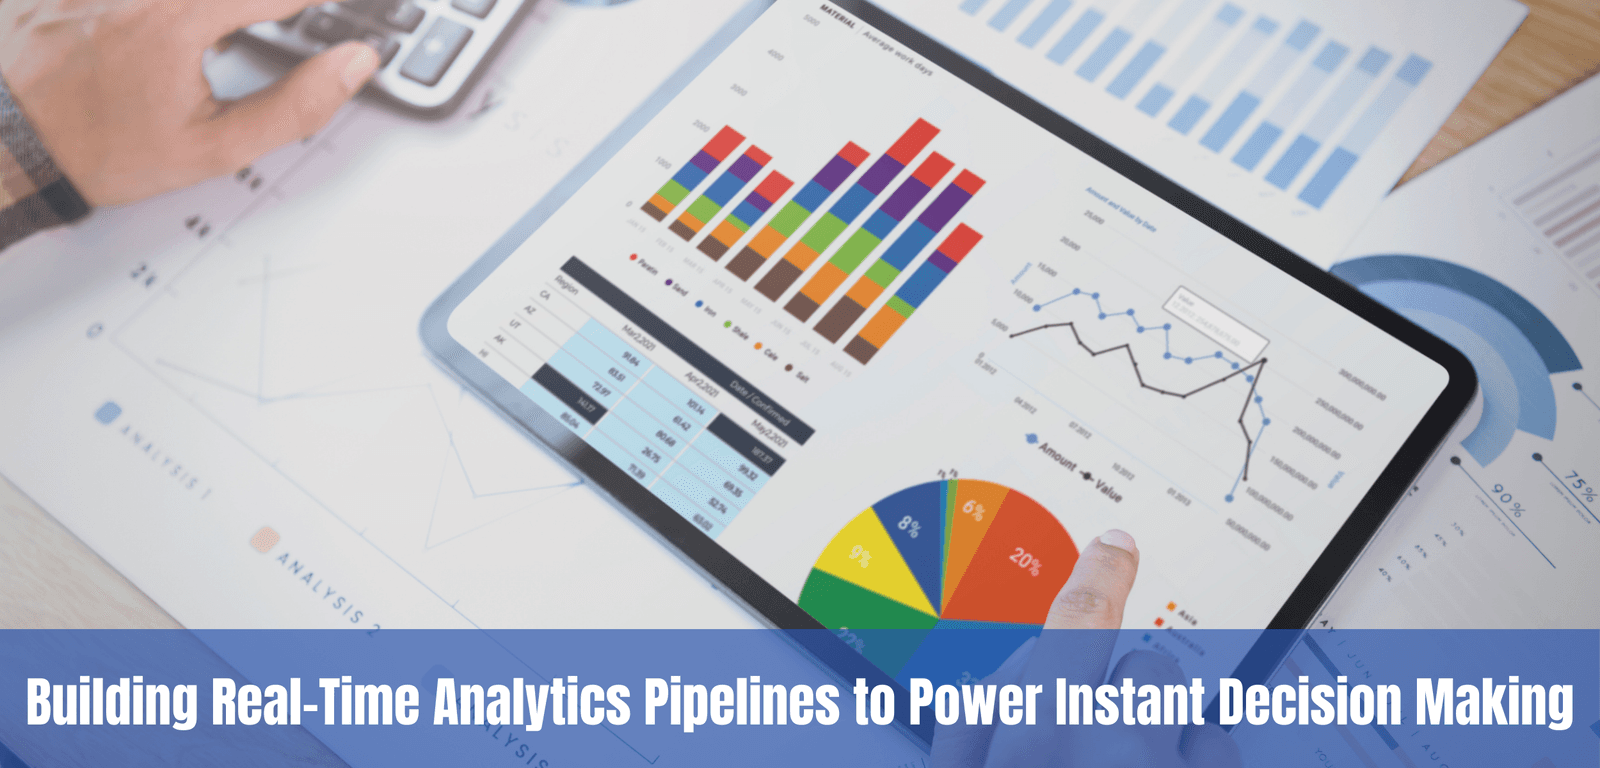
Design a near real-time pipeline to monitor orders per minute
Tests stream architecture and batch trade-offs. Outline: Kafka or Kinesis ingestion, Flink with tumbling windows, Druid or Pinot storage, Grafana alerts. Contrast batch on latency, exactly-once semantics, and cost. Red flag: calling cron SQL real-time.
How do you optimize a data warehouse for billions of rows?
Tests physical design in columnar warehouses at scale. Strong answers cover partition and cluster pruning, materialized views or rollups to reduce joins, caching and search indexes for hot paths, and reserved slots or autoscaling.

Design an experiment and logging to link API latency to engagement
Causal inference and data integration. Randomly inject latency for a treatment group with a control at baseline, then join server trace IDs to client events via a shared request ID. Never confuse correlation with causation or miss join issues.
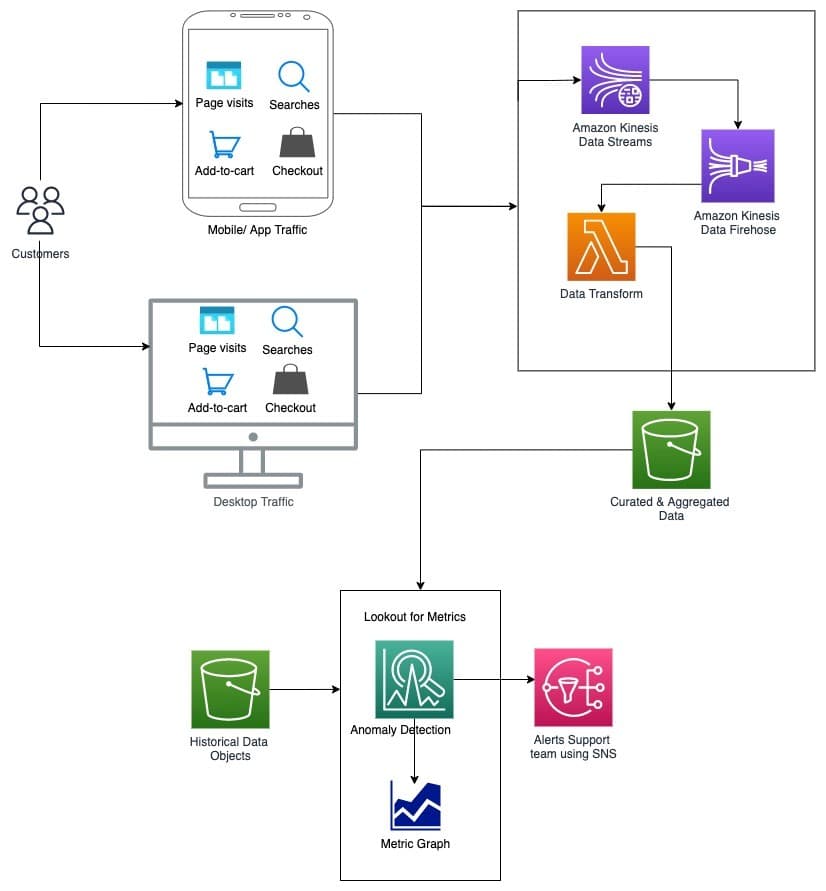
Design a system to detect sudden add-to-cart drops in real time
This tests streaming pipeline design and seasonality-aware anomaly detection. Outline Kafka or Kinesis ingestion, windowed aggregations, and ML baselines tuned to hourly and weekly trends. Red flag: static thresholds that ignore daily patterns.

Describe two methods for generating prediction intervals or probabilistic forecasts
Tests uncertainty quantification for risk-adjusted decisions. Strong answers: (1) parametric intervals via forecast error variance and normal multipliers, (2) bootstrap residual resampling for empirical percentiles.

Explain how CUPED increases statistical power and required data
Tests ANCOVA variance reduction. Answer: CUPED regresses pre-experiment X on Y, shrinking variance by (1-ρ²); needs pre-randomization prognostic baseline; beats difference scores. Red flag: calling it Y-X subtraction or saying it changes the effect.
Why is user-level randomization flawed by spillover and what is an alternative?
Network interference. A/B tests violate SUTVA when treatment spills across edges, biasing effects. Cluster randomization uses network clusters and Horvitz-Thompson weighting for unbiased estimates.
Why can't you t-test p99 latency, and what's a valid alternative?
Explain that t-tests target means while p99 variance depends on tail density; propose bootstrap CIs or permutation tests.

Describe data architecture for fast multi-dimensional slicing and pre-computation trade-offs
Tests analytical architecture trade-offs between latency and cost. Strong answers propose a hybrid pipeline: columnar warehouse for flexible exploration plus pre-aggregated OLAP cubes for sub-second dashboards.
How would you validate a feature's conversion impact given self-selection bias?
Tests causal inference for opt-in features. Strong answers use quasi-experiments like propensity matching or diff-in-diff to compare similar users and verify pre-trends. Red flag: a raw t-test between adopters and non-adopters ignoring selection bias.
How would you visually represent statistical uncertainty in a chart?
Awareness that plotted points are perceived as exact truths. Replace isolated bars with intervals showing point estimate uncertainty; add hypothetical outcome plots to make values tangible. Offering p-values or raw means without visualizing uncertainty range.
How do you build a performant visualization for millions of time-series points?
Tests end-to-end data reduction: backend bucket downsampling like LTTB preserves visual shape, frontend uses level-of-detail rendering and viewport culling. Red flag: naive every-Nth sampling that drops peaks or sending raw millions to the browser.

How do you manage event schema evolution without breaking reports?
Backward-compatible serialization, nullable new fields, raw versus modeled layers, versioned schemas, and consumer alerts.
What are the challenges of grouping by a high-cardinality dimension?
Tests columnar storage internals and query engine scalability. A strong answer covers memory pressure from giant hash tables, destroyed compression ratios, and massive result-set overhead.
We are hiring for this. Every open role lists the topics its interview covers, so you can prepare for the real thing rather than guessing.
See open roles