Easy everything in Analytics & Metrics

How do you measure forecast accuracy and compare MAE to RMSE?
This tests out-of-sample validation and how MAE and RMSE weight errors. A strong answer demands a train-test split, defines both, and notes RMSE punishes outliers more while MAE is more robust. A red flag is citing in-sample fit instead of held-out error.
Instrument a mobile event and surface it in analytics
This tests full-stack analytics plumbing. A good answer hits: structured client logging, batched transmission, backend validation, warehouse aggregation, and dashboard verification. A red flag is fire-and-forget logging with no schema checks or reconciliation.
What data do you need and what steps build a WAU dashboard?
Tests defining a metric, modeling events, and wiring them into a BI tool. A strong answer names the feature event, sets a rolling 7-day window, counts distinct users by period, and configures the BI layer. Red flag: jumping to charts before defining active.

Describe client-side events and properties to track Export to CSV usage
This tests telemetry design for async actions. A strong answer defines three custom events—click, success, failure—with properties like location, file_size, error_code, and user_id, fired at the right lifecycle moments.

Describe tracking a user event end-to-end from frontend to BI tool
Mention frontend instrumentation, routing, ingestion, warehouse transforms, and BI querying.
How would you design UTM capture and attribution persistence?
Capture UTMs on landing, store in a first-party cookie with TTL, attach to events, and persist on conversion.
What event and data payload track Add to Cart actions?
This tests GA4 ecommerce schema design. Fire add_to_cart with items array containing item_id, price, currency, quantity; include user_id, user_segment, session_id, and timestamp. Red flag: generic button_click with DOM selectors instead of semantic data.
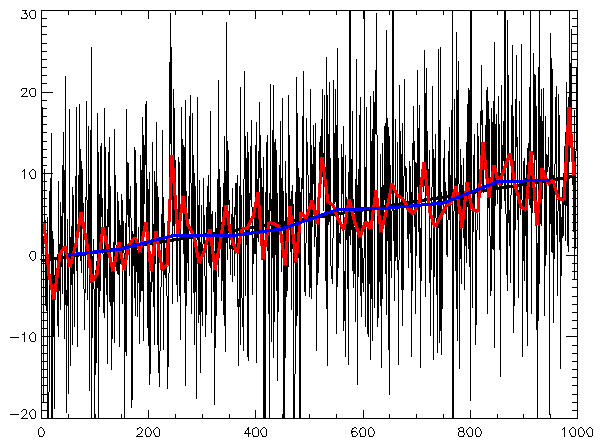
Describe key components for EDA on three years of daily user sign-ups
This tests time-series decomposition intuition. A strong answer covers trend, seasonality, and noise via plots, autocorrelation, and calendar effects, plus checks for missing days and outliers. Red flag: jumping to forecast models before validating structure.

Design an A/B test for a 'Buy Now' button color change
Tests structured experiment design from hypothesis to metric. Strong answers: define a falsifiable hypothesis; pick purchase conversion as primary; size the sample and duration; randomize by user; pre-commit to stopping rules.
What does a p-value of 0.03 mean at alpha 0.05?
0.03 means 3% chance of data this extreme if the null (no effect) holds; since 0.03 < 0.05, reject the null.
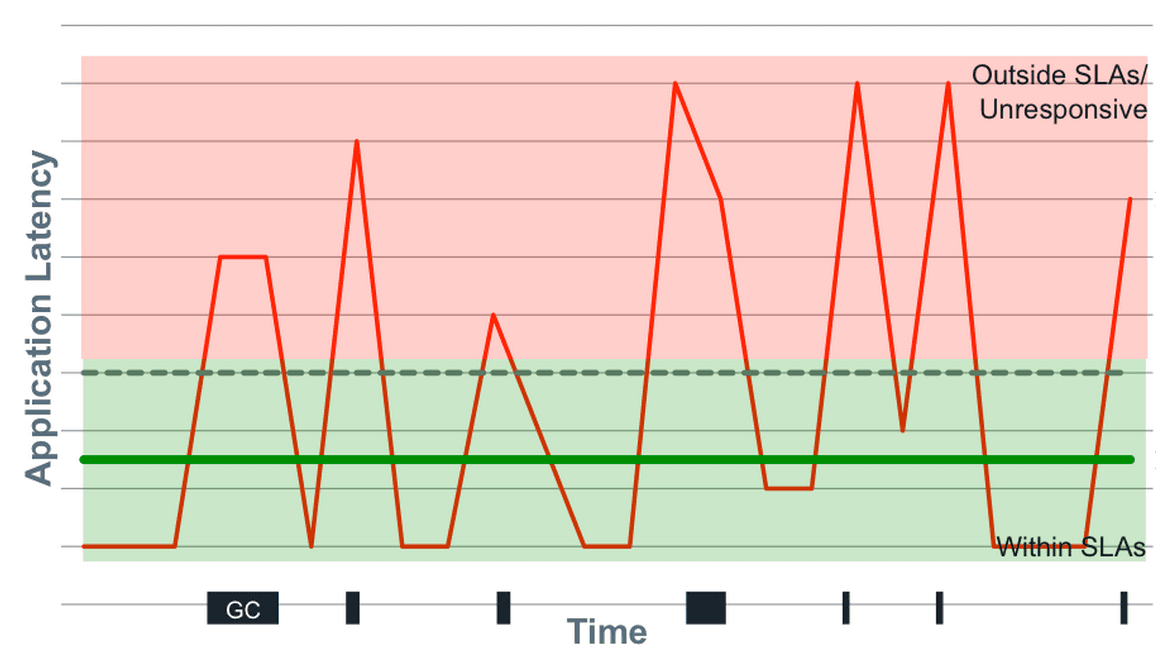
Mean or median for API response times?
Tests if you know latency is skewed and outlier-sensitive. Pick median over mean because hiccups distort the mean, but note median hides tail latency. Advocate for p95, p99, and max. Red flag: defending mean as representative or ignoring tail behavior.
How would you determine if Feature X causally drives higher retention?
Tests causal inference intuition for product metrics. Great answers propose a randomized holdback or instrumental variable, control for user intent, and estimate a local average treatment effect.
What user segments do you check first after a 10% DAU drop?
Validate by time, platform, and geography; then slice by new vs returning, channel, and feature usage to isolate the bleeding cohort.
Compare five companies' market share: bar or line chart?
This tests categorical vs. temporal encoding. Pick a bar chart because companies are discrete categories, not a time series; line charts falsely imply sequence or trend. Calling a line chart acceptable is a red flag.

When is a pie or donut chart appropriate?
Tests judgment of part-to-whole encoding. Answer: use for few categories with clear dominance, cite a share scenario like device traffic, and name angle-comparison difficulty and 3D distortion as pitfalls.
Why prefer median and p95 over mean for API latency?
This tests statistical intuition for skewed distributions. A strong answer notes that median captures typical experience, p95 captures tail suffering, and mean hides outliers. A red flag is claiming mean alone is sufficient.

What is a data schema and why enforce it at ingestion?
Tests schemas as contracts and ingestion validation as a quality gate. Strong answers cite blueprints with constraints, fail-fast ingestion catching type errors upstream, and downstream trust. Red flag: treating schemas as optional docs affecting only storage.
What validation checks would you implement for a user-submitted email field?
Tests whether you separate syntax validation from deliverability and know practical ingestion guards. A strong answer covers RFC-aware syntax, domain checks, normalization, and deduplication.
How do you handle 10% nulls in a key numerical column?
Check MCAR/MAR/MNAR; prefer median or mean imputation; add an "is_missing" indicator.

Explain data warehouse purpose and how it differs from OLTP
This tests whether you know the OLTP versus analytics split. A great answer contrasts OLTP row-level writes and normalized schemas with warehouse denormalized schemas and BI reads. A red flag is calling a warehouse just a bigger OLTP database.
We are hiring for this. Every open role lists the topics its interview covers, so you can prepare for the real thing rather than guessing.
See open roles