Interview questions in Analytics & Metrics, page 17
Investigating analytics vs database count gaps
Causes include ad-blocker loss, differing identity logic, timezone mismatches, filtering, and pipeline delay; investigate by aligning definitions and tracing one user.
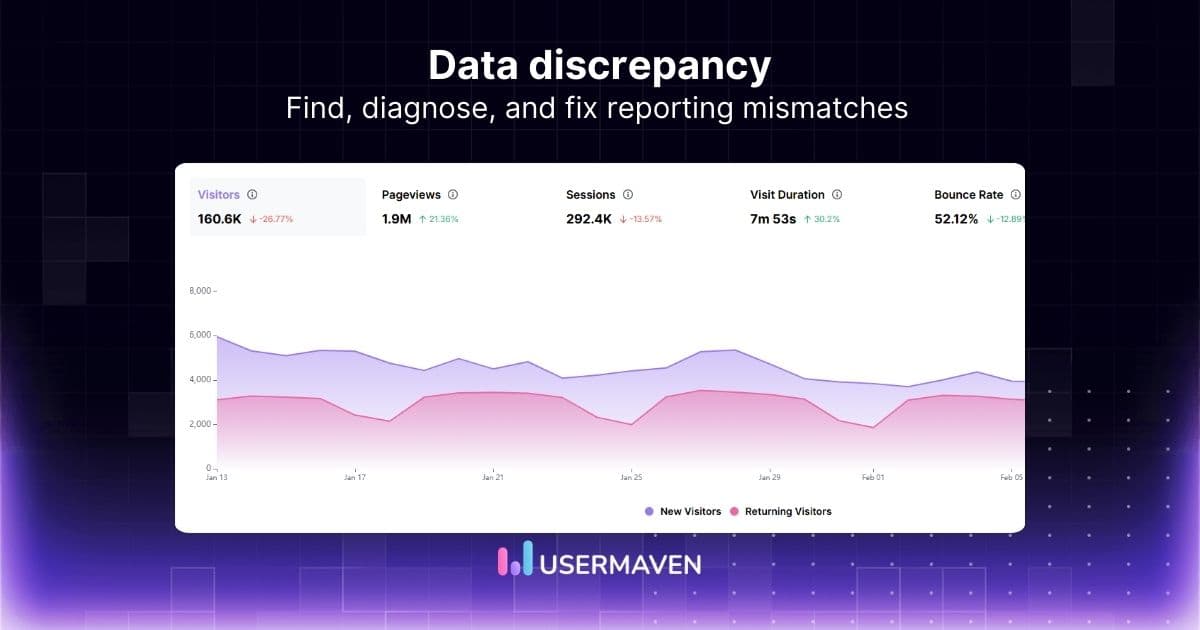
Why do our analytics and backend user counts not match?
This tests your ability to systematically debug data integrity issues. A great answer first defines the metric, then investigates tracking implementation, privacy blockers, and time zone settings. A red flag is blaming one tool without a structured plan.
Why don't analytics and backend user counts match?
This tests your systematic debugging and understanding that 'user' has different definitions. A good answer first defines 'user' in each system, then investigates tracking implementation, timing differences, and filtering.
Bundled analytics vs warehouse-native trade-offs
Warehouse-native gives one source of truth and SQL flexibility but shifts modeling, performance, and UX onto your team; bundled tools are turnkey but siloed.
Trade-offs: Bundled Analytics vs. a Warehouse-Native Stack?
This tests your grasp of modern data stack trade-offs: cost, data governance, and flexibility. Discuss the pros of warehouse-native (unified data, lower cost, security) vs. the cons (loss of specialized UI, implementation complexity).
Trade-offs: Bundled vs. Warehouse-Native Product Analytics
This tests your grasp of modern data stack architecture. A great answer weighs trade-offs in data control, cost, query flexibility, and team capabilities. A red flag is ignoring total cost of ownership and engineering overhead for a warehouse-native setup.
Building a conversion funnel in SQL
Count distinct users reaching each ordered step, compute step-over-step conversion; the biggest drop-off is the lowest consecutive ratio.

Build a SQL query for a multi-step conversion funnel
Tests your ability to translate a product question into robust SQL. A great answer uses CTEs or left joins to count users at each step, defining the attribution model (e.g., first-touch) and time windows. A red flag is a naive query that double-counts users.
How would you build a SQL query for a conversion funnel?
Tests your ability to translate a business need into a technical SQL solution. A good answer uses CTEs or LEFT JOINs to model sequential steps, counts users at each stage, and discusses attribution.
Client vs server tracking: pros, cons, examples
Client-side wins on UI context but loses data to blockers and tampering; server-side wins on reliability and trust but misses pure UI events.
Client-Side vs. Server-Side Event Tracking: Pros and Cons
Tests your grasp of data integrity trade-offs. A good answer defines both, contrasts reliability vs. implementation ease, and gives clear examples like 'payment_processed' (server) vs. 'button_click' (client). Red flag: Ignoring ad-blockers and data loss.
Client-Side vs. Server-Side Event Tracking
Tests your grasp of data integrity and architectural trade-offs. A great answer defines both, favors server-side for reliability (avoids ad-blockers), but notes client-side's richness for UI events. A red flag is presenting them as equal choices.
Calculating Daily Active Users in SQL
Need per-event user_id and timestamp and a clear active definition; count distinct user_id within the day in a fixed timezone.

Calculate Daily Active Users (DAU) with SQL
This tests your ability to translate a business metric into a precise technical definition and query. A good answer defines "active," specifies the event data needed (user_id, timestamp, event_name), and uses COUNT(DISTINCT user_id).
Calculate Daily Active Users (DAU) with SQL
This tests product sense and SQL fundamentals. Define 'active' with a core product action, describe the event data needed, then write a COUNT(DISTINCT user_id) query. A red flag is writing SQL before defining the business logic for 'active'.
Find leading indicators of long-term churn
Cohort renewers vs churners, compare first-30-day engagement depth and breadth, validate correlations and check causality.

How would you find leading indicators for long-term churn?
Tests your ability to connect a lagging business KPI to leading product metrics. A good answer defines churned/retained cohorts, analyzes first 30-day engagement differences (e.g., feature adoption), and validates findings. A red flag is jumping to ML models.
Find leading indicators for long-term churn
This tests your ability to translate a business problem into a data investigation. A strong answer defines churned vs. retained cohorts, hypothesizes key early behaviors, and compares their frequency to find a leading indicator.
Reframe time series for a tree model
Lag and rolling-window features, calendar and cyclical encodings, then split chronologically to avoid leakage.
Transform a Time Series for a Gradient Boosting Model
Tests your ability to convert a sequential problem into a tabular one. A great answer covers creating lagged/rolling features and time-based features (e.g., day of week), and crucially, specifies a time-aware validation split.
We are hiring for this. Every open role lists the topics its interview covers, so you can prepare for the real thing rather than guessing.
See open roles