Concepts in Analytics & Metrics

Key Performance Indicators (KPIs)
A KPI isn't just any metric; it's a measurable value showing how effectively you're achieving a key business objective. It's used to track things like website uptime or customer acquisition cost.
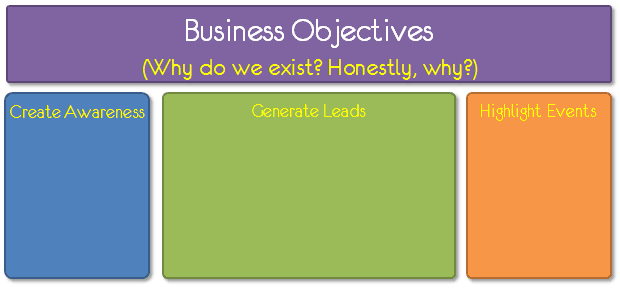
Analytics Measurement Plan: From Why to What
An analytics measurement plan forces you to define success before you look at data. It connects high-level business objectives to specific user actions and sets clear targets.
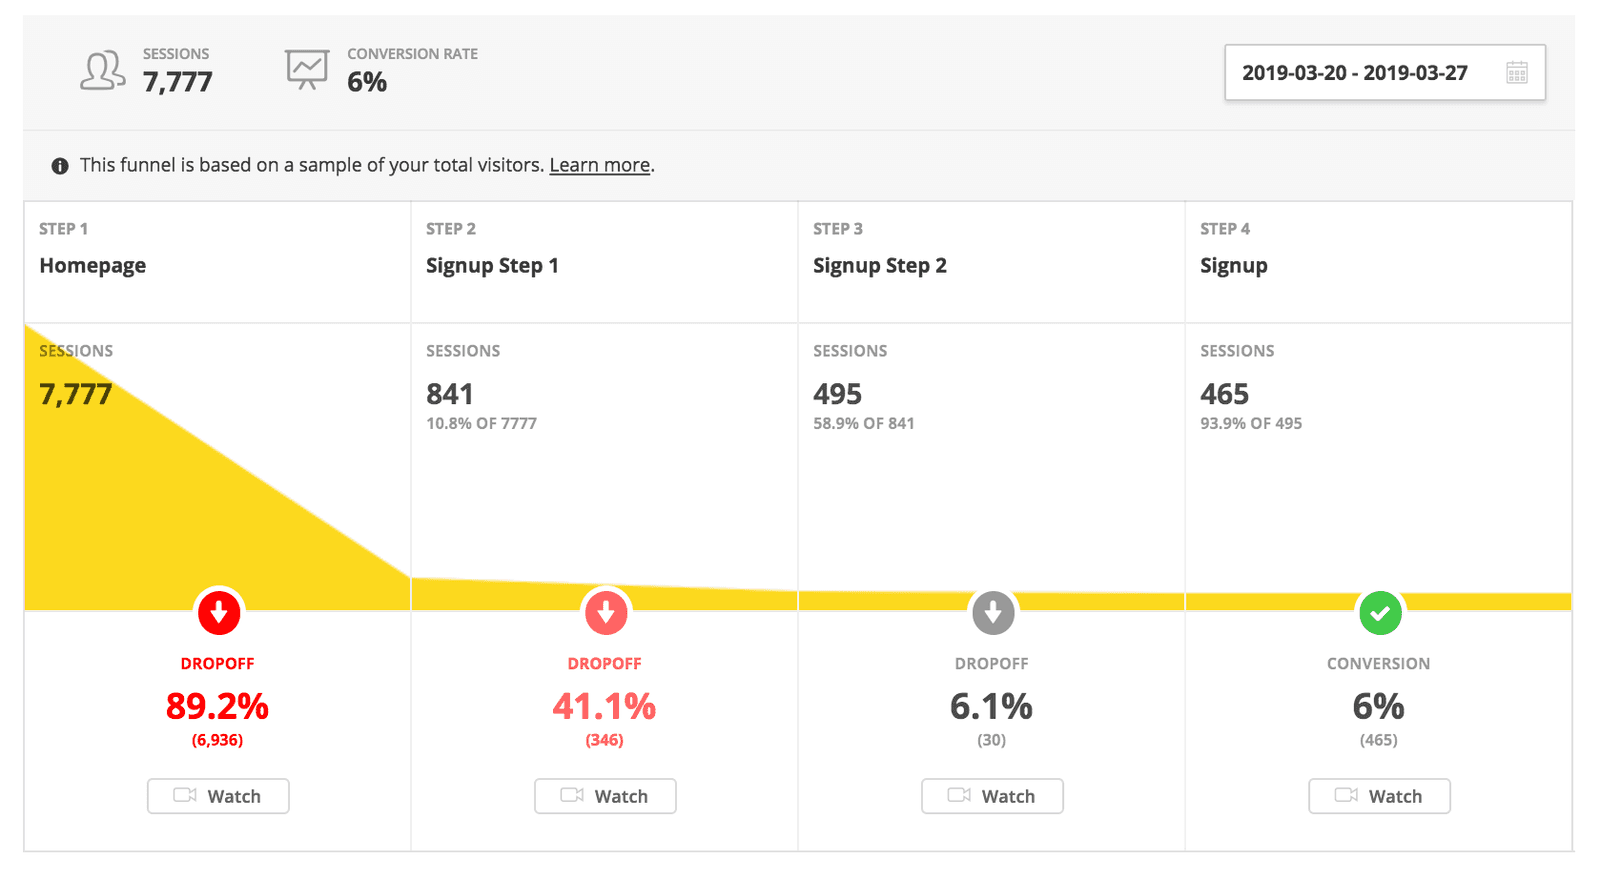
Funnel Analysis: Pinpointing Where Users Drop Off
Funnel analysis treats a user journey like a real-world funnel, showing exactly where people 'leak' out before reaching a goal. It's key for optimizing e-commerce checkouts or app sign-ups. The footgun is only looking at the final conversion rate.
Leading vs. Lagging Indicators: Looking Forward vs. Backward
Leading indicators predict the future; lagging indicators confirm the past. This distinction is key for analyzing business cycles or system health. The main footgun is relying only on lagging data, forcing you to react to problems that have already occurred.
Cohort Analysis: Comparing User Groups Over Time
Instead of averaging all user behavior, cohort analysis groups users by a shared starting point, like their sign-up month. This reveals how product changes affect retention for specific groups. The footgun is lumping everyone together, which hides real trends.
Customer Segmentation: Treat Different Customers Differently
Instead of treating all customers the same, segmentation groups them by shared behaviors or traits. This helps tailor marketing campaigns or manage relationships.
Balanced Scorecard: Beyond Financial Metrics
A Balanced Scorecard connects daily actions to long-term strategy by measuring more than just financial results. It's used to align department goals with company objectives, ensuring work supports customer satisfaction.
Data-Driven vs. Data-Informed: Let Data Guide, Not Dictate
Data-driven means the data makes the call, like in an A/B test. Data-informed means a human makes the call, using data as one key input for strategic choices like setting a budget. The footgun is saying 'data-driven' when you mean 'data-informed'.

Event Tracking: Measuring What Users Do
Event tracking turns user actions like clicks and purchases into analyzable data. Analytics platforms use this data to report on engagement and conversions. The biggest footgun is inconsistent naming, which pollutes your data and breaks reports.
UTM Parameters: Know Exactly Where Your Traffic Comes From
UTM parameters are like labels on your website visitors, telling you which marketing campaign brought them. They're added to URLs in ads or emails to measure channel effectiveness. The footgun is inconsistent naming, which splits data and ruins analysis.
Tag Management Systems: Control Your Analytics Snippets
A Tag Management System (TMS) is a single container for all the analytics and marketing scripts you'd otherwise hardcode. Instead of asking engineers to add new scripts, you add them via a web UI.
Analytics Consent Management: Respecting User Choices
Consent management is the system that asks users for tracking permission and technically enforces their choice. It's legally required for sites using Google Analytics or Ads.

The Data Layer: Your Web Page's Central Message Bus
The data layer is a central message bus for your website, decoupling your app from analytics tags. It passes dynamic data like purchase totals or button clicks to tools like Google Tag Manager, which listens for these events to fire tags.
User ID: The Key to Cross-Device Analytics
A User ID stitches together a person's journey across devices and sessions, moving beyond anonymous tracking. It's key for apps with logins to see the full customer lifecycle. The footgun: never use the User ID for a custom dimension; it will break reporting.

Client-Side vs. Server-Side Tracking
The difference is who sends your data: the user's browser (client-side) or your server (server-side). Client-side is simple but fragile against ad blockers. Server-side offers more control but adds cost. The footgun is thinking server-side is a magic fix.
Event Autocapture: Low-Effort Frontend Analytics
Event autocapture is like a security camera for your UI, recording all user interactions automatically. It's used in web analytics to capture clicks and page views with minimal setup, letting you analyze behavior without manually instrumenting every button.
Customer Data Platform (CDP): Your Customer's Single Source of Truth
A Customer Data Platform (CDP) creates a single, persistent profile for each customer by unifying data from siloed sources. It's used for real-time personalization and AI-driven marketing. The footgun is confusing it with a CRM, which manages relationships.
Event Data Pipelining: From Raw Events to Analytics
Treat data not as static tables but as a continuous stream of events. Event data pipelining builds the infrastructure to capture, process, and deliver this real-time flow for analytics or AI applications.
Log Analysis: Reading Your System's Story
Log analysis turns raw, machine-generated records into a coherent story about your system's health, security, and performance. It's crucial for debugging production failures or investigating security incidents.

ETL: The Assembly Line for Your Data
ETL (Extract, Transform, Load) is an assembly line for data, moving it from various sources into a single destination for analysis. It's used to populate data warehouses by combining data from databases, logs, and APIs into a unified view.
We are hiring for this. Every open role lists the topics its interview covers, so you can prepare for the real thing rather than guessing.
See open roles