Advanced everything in Analytics & Metrics, page 2
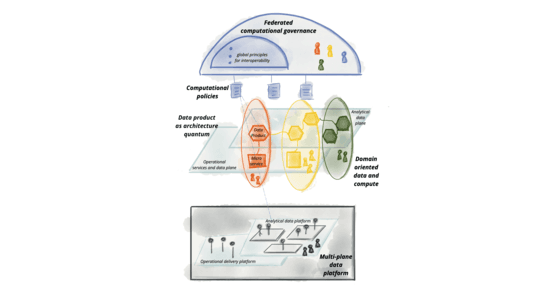
Design a scalable data governance framework balancing autonomy and control
Self-serve platform with domain products, auto-catalog, schema contracts, and policy-as-code access in CI/CD.
How do you root-cause bad data across microservices and Spark?
This tests structured debugging and observability for distributed pipelines. A strong answer isolates the break via lineage, validates schema and freshness per stage, and compares microservice outputs to Spark inputs.

Design a data quality framework from source to consumption
This tests full-lifecycle data architecture. Strong answers define ownership first, then schema contracts at ingestion, profiling and anomaly detection in CI/CD, column-level lineage, and KPI-linked scorecards. Red flag: tools before ownership or RACI.
Diagnose out-of-memory errors in a growing Spark job
Inspect plans for skewed partitions and joins; tune shuffle partitions, batch sizes, and join strategies; leverage AQE and statistics.

How do you guarantee at-least-once event delivery for a financial transaction?
Write events to a DB outbox in the same transaction as the biz update; a relay polls and publishes to analytics.

Design client-side event batching and prevent unload data loss
It tests balancing network efficiency and data reliability in browser analytics. Strong answers cover in-memory batching with size or time triggers, sendBeacon or fetch keepalive on visibilitychange, and a retry queue.

How do you measure data platform ROI and track it?
Cite adoption, time to insight, downtime cost, and cost per workload; then describe cost tags and usage telemetry.
How would you develop balanced KPIs for a two-sided marketplace?
Tests dual-sided metric design beyond B2C playbooks. Strong answers define buyer and seller liquidity separately, prioritize match rate over GMV, and monitor supply-demand balance granularly.
Design a Column-Level Data Lineage System at Scale
Tests your ability to design a metadata system with three distinct components. A strong answer outlines collection (e.g., OpenLineage), storage in a graph database (e.g., Neo4j), and visualization for impact analysis.

A key metric dropped 20%. How would you investigate?
This tests systematic diagnosis of critical issues. A great answer segments the drop (by region, platform), then traces data upstream from the dashboard to the source, correlating with technical metrics. A red flag is jumping to code before scoping the impact.
Design an experiment to isolate long-term impact from novelty effect
Tests if you can design experiments for long-term impact, not just short-term lift. A good answer involves a long-running test, segmenting users by tenure, and modeling the effect over time to find its stable asymptote.
Design a Real-Time Analytics Pipeline for Mobile Events
This tests your grasp of low-latency streaming architectures. A good answer outlines ingestion (SDK to Kafka/Kinesis), real-time processing (Flink/Spark), and sinking to a fast OLAP database (Druid/ClickHouse). A red flag is proposing a batch-based ETL design.

Design a Near Real-Time Analytics Pipeline
Tests your ability to design a low-latency data system and articulate trade-offs. A good answer covers ingestion (Kafka), processing (Flink), storage (Druid), and visualization (Grafana), contrasting the architecture's low latency with a batch setup.
Optimizing a Slow, Expensive Data Warehouse for BI Dashboards
Tests your grasp of data warehouse architecture beyond basic SQL. A great answer covers partitioning/clustering, materialized views for pre-aggregation, and cost controls. A red flag is suggesting only query rewrites or just 'adding more compute'.

Correlate API Slowness with User Engagement
This tests your ability to design a controlled experiment and join disparate data. A good answer outlines an A/B test with an artificial delay, logging with shared IDs, and statistical analysis. A red flag is proposing a purely observational study.
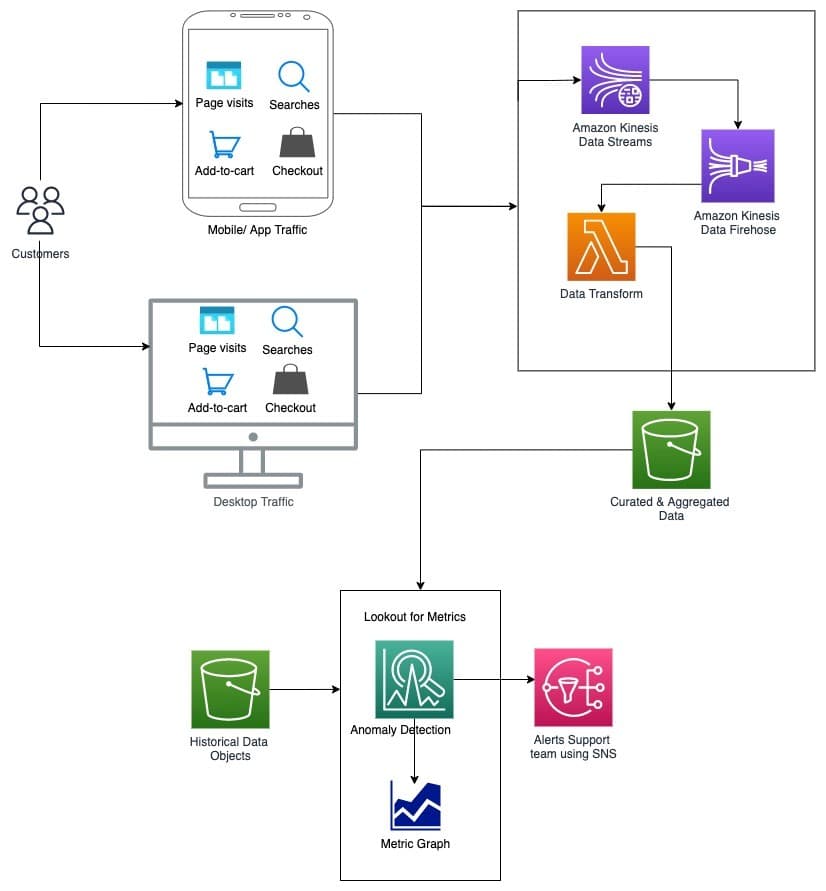
Design a Real-Time Anomaly Detection System for E-commerce Events
This tests your ability to design a real-time data pipeline and apply ML to a business problem. Outline a streaming architecture (e.g., Kinesis), processing, and storage.

Describe two methods for generating prediction intervals
This tests your grasp of uncertainty quantification. A great answer contrasts an analytical method (assuming normal errors, using multipliers like 1.96 for 95%) with a simulation method (bootstrapping residuals).
How do you diagnose and fix a model's degrading performance?
Tests your MLOps process for handling model decay. Name it "concept drift," then outline a plan: diagnose by comparing data distributions, solve with a targeted retraining strategy, and implement proactive monitoring. A red flag is just saying "retrain it."

How CUPED increases statistical power in experiments
Tests your grasp of variance reduction in A/B testing. Explain how CUPED uses correlated pre-experiment data to reduce outcome variance, increasing statistical power. A red flag is confusing it with simpler difference scores, which can actually increase noise.
Why is user-level randomization flawed by spillover effects?
Tests your grasp of SUTVA violations in network experiments. Explain how spillover contaminates the control group, then propose graph cluster randomization—grouping users and assigning entire clusters to A/B variants—to minimize interference.
We are hiring for this. Every open role lists the topics its interview covers, so you can prepare for the real thing rather than guessing.
See open roles