Easy everything in Analytics & Metrics, page 3
Why use median/p95 for API latency instead of the mean?
This tests if you understand how long-tail distributions make averages misleading for user experience. A good answer explains that median (p50) shows the typical user, while p95 captures the worst-case experience.

What is a data schema and why enforce it on ingestion?
This tests your understanding of data contracts. A great answer defines a schema as a data blueprint, then explains how early enforcement prevents bad data, ensuring consistency and reliability for analytics. A red flag is only defining the term.
What validation checks would you implement for an email field?
Tests your understanding of practical validation vs. theoretical purity. A great answer prioritizes user experience, uses simple syntax checks (like a single '@'), and relies on sending a verification email as the ultimate test.
How would you handle 10% null values in a key column?
This tests your understanding of data cleaning trade-offs. First, investigate the cause of nulls. Then, discuss simple imputation (mean/median) vs. discarding rows, weighing pros and cons. A red flag is jumping to a solution without asking about the data.

What is a data warehouse vs. a transactional database?
Tests your grasp of systems optimized for different access patterns (writes vs. reads). Define OLTP for transactions and OLAP for analytics. Contrast their schema (normalized vs. denormalized), data, and workload. A red flag is calling it a 'big database'.
Build a pipeline to load a daily CSV into a database
This tests your ability to connect basic cloud services (storage, compute, database) into a simple, event-driven data pipeline. A good answer mentions an event trigger (S3), a serverless function (Lambda), and a database (RDS), plus error handling.

ETL vs. ELT: Key Differences and When to Use Each
This tests your grasp of data pipeline trade-offs. Define ETL (transform first) vs. ELT (load first), contrasting transform location and data state. A red flag is ignoring how cloud warehouses make ELT the modern default for flexibility.

Translate 'increase engagement' into a technical measurement plan
This tests your ability to translate a vague business goal into a structured, measurable technical plan. Clarify the goal with the PM, define a primary metric and supporting metrics, then create an instrumentation spec.
Instrumenting a New User Interaction for Analytics
Tests your grasp of the full data lifecycle. A good answer covers event definition, client-side implementation, the backend pipeline, and end-to-end verification.
How would you build a weekly active user dashboard?
This tests your ability to translate a business request into a technical plan. A good answer defines "active," identifies necessary data (user ID, timestamp, event), outlines the data modeling, and explains the BI tool implementation.

Track an 'Export to CSV' button's usage and outcomes
This tests your ability to design a robust event schema, not just track a click. A great answer uses one custom event name with a 'status' parameter ('initiated', 'success', 'failure'). A red flag is suggesting multiple event names for one action.

Track a user event from frontend code to a BI tool
Tests your understanding of the modern data stack. A good answer traces the event from frontend capture, through an ingestion pipeline, into a data warehouse, and finally to a BI tool for analysis. A red flag is describing only one part of the journey.
How would you capture and persist UTM parameters for attribution?
Tests your grasp of state management and data persistence for analytics. A good answer covers capturing UTMs with JS, persisting them in a cookie, and associating them with a user record on the server during a conversion event.
Describe the client-side event for an 'Add to Cart' button
This tests your ability to design analytics events for future analysis. Name a standard event like add_to_cart and list item parameters (item_id, price, quantity).

How would you measure a sales forecast model's accuracy?
This tests your ability to connect statistical metrics to business impact. A great answer defines MAE (linear error cost) and RMSE (penalizes large errors), explains the choice depends on business context, and stresses using a test set.
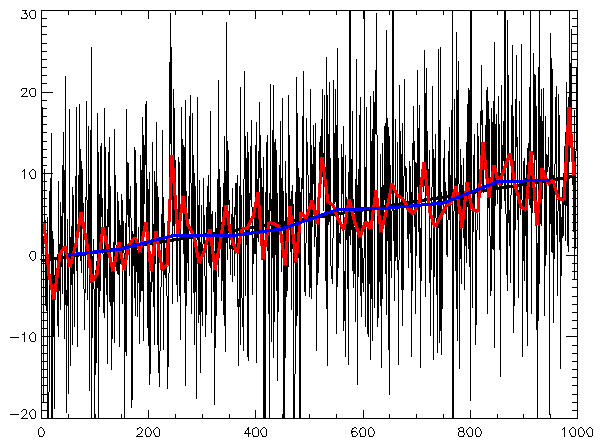
Describe EDA for a 3-year daily user sign-up dataset.
Tests your structured approach to time series EDA. A good answer identifies trend, seasonality, and anomalies before modeling. A red flag is jumping to forecasting models or only mentioning the overall average growth, ignoring cyclical patterns.

How would you A/B test a 'Buy Now' button color change?
This tests structured thinking. A good answer defines a hypothesis, selects primary and guardrail metrics, and outlines the experiment's duration and analysis plan. A red flag is focusing only on clicks without considering business impact.
What does a p-value of 0.03 mean in an A/B test?
Tests your practical statistical literacy. A good answer defines the p-value (3% chance of this result if the null is true), compares it to alpha (0.03 < 0.05) to reject the null, and decides to ship.
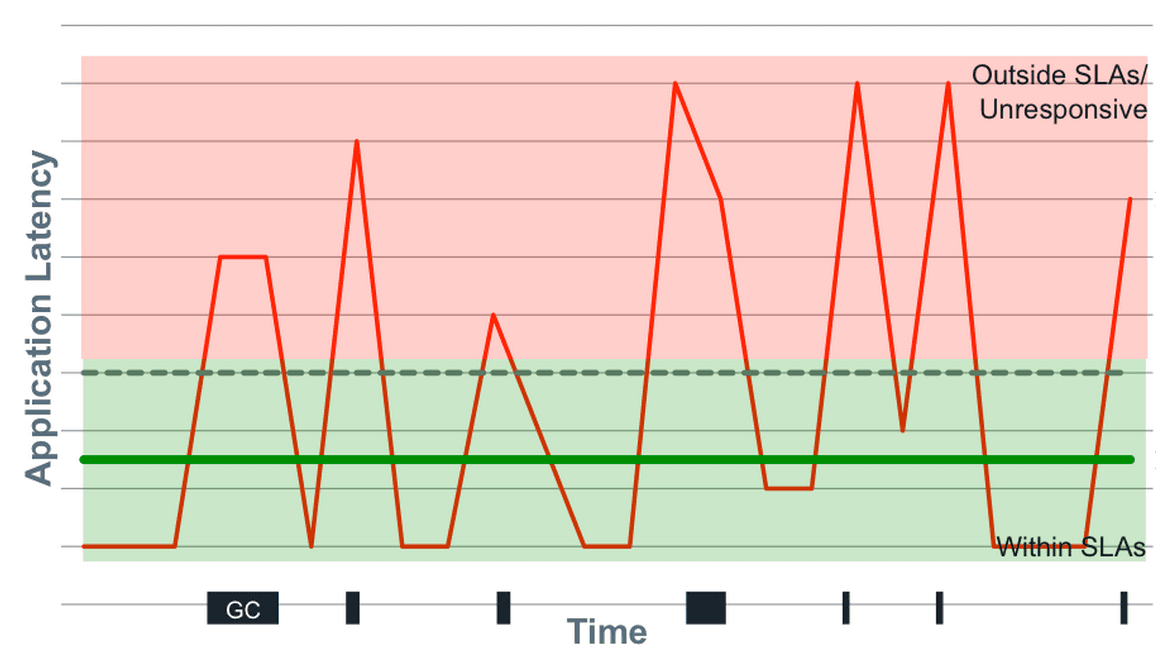
Mean vs. Median for API Response Times?
Tests if you know latency data has outliers. A good answer chooses median because it's robust to extremes. Explain that mean gets skewed by a few slow requests (e.g., GC pauses), hiding the typical user experience.
Is 20% higher retention from Feature X causal or correlational?
This tests your ability to distinguish correlation from causation. A great answer questions the data, identifies confounding variables (e.g., power users), and proposes a randomized A/B test as the gold standard to prove causality.
We are hiring for this. Every open role lists the topics its interview covers, so you can prepare for the real thing rather than guessing.
See open roles