Concepts in Data Science & Analytics, page 6
Policy Gradient: Teach an Agent What to Do, Not What's Valuable
Policy gradient methods directly learn what action to take, rather than learning the value of states. They excel in continuous action spaces like robotics or when the best policy is random.
Hadoop: Processing Big Data on Cheap Hardware
Hadoop processes massive datasets by distributing work across many cheap computers, assuming some will fail. It's used for large-scale batch processing, not real-time queries. The footgun is treating it like a database instead of a batch processing framework.
HDFS: Store Big Data on Cheap, Unreliable Hardware
HDFS stores huge files across many cheap computers by assuming they will fail. It achieves reliability by replicating data, not by using expensive hardware. Use it for batch processing, but avoid it for low-latency access or many small files.
YARN: Hadoop's Cluster Operating System
YARN acts as the operating system for a Hadoop cluster, separating resource management from job processing. This allows multiple engines like Spark or MapReduce to run on the same hardware.
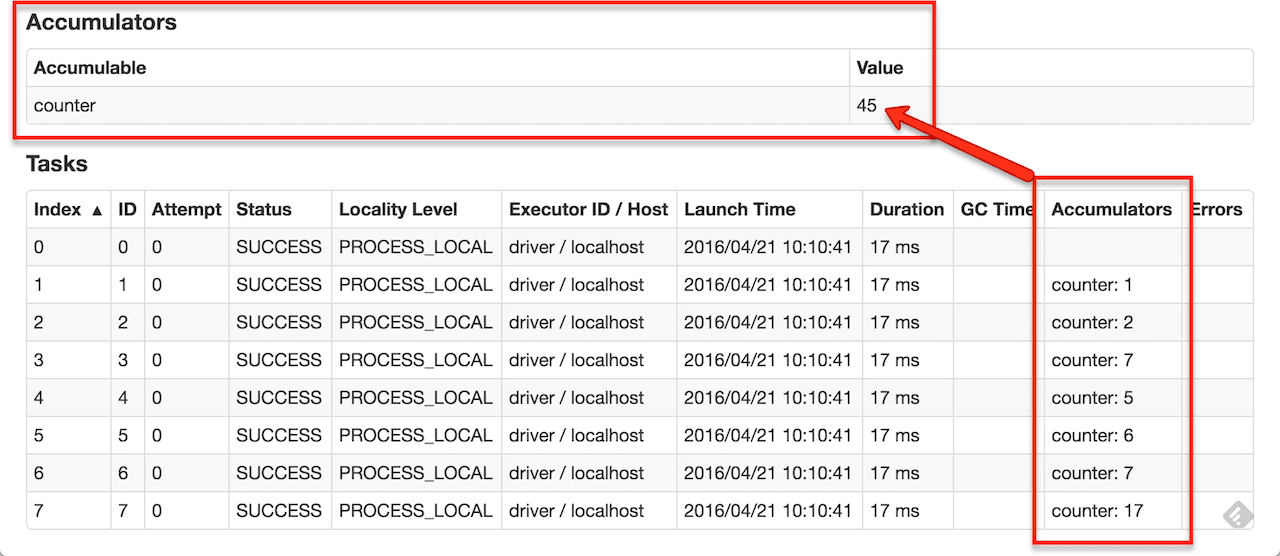
Spark RDDs: Immutable, Distributed Data Collections
An RDD is Spark's core abstraction: an immutable, partitioned collection of items processed in parallel. It's the go-to for low-level, unstructured data tasks. The main footgun is using RDDs when higher-level DataFrames offer better performance.
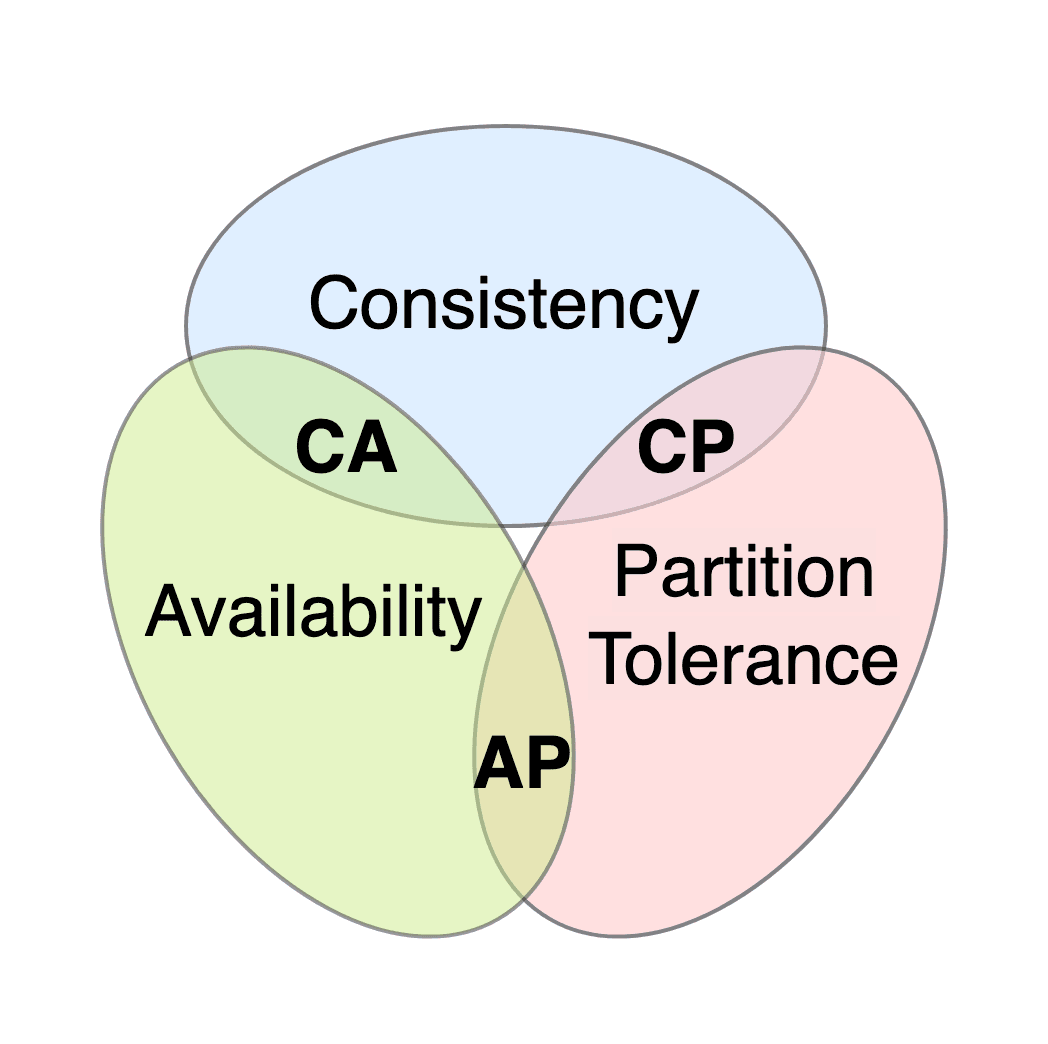
CAP Theorem: Pick Two of Three Guarantees
The CAP Theorem states a distributed system can only have two of three guarantees: Consistency, Availability, or Partition Tolerance. When the network fails (a partition), you must choose: stop responding to ensure data is consistent (CP) or keep responding…
Apache Hive: SQL on Hadoop
Apache Hive translates SQL-like queries into Hadoop MapReduce jobs, letting you analyze huge datasets with familiar syntax. Don't mistake it for a real-time database; its power is in high-throughput batch processing, not low-latency queries.
Columnar Storage: Read Less Data, Analyze Faster
Columnar formats like Parquet store data by column, not by row. This makes analytical queries that select a few columns from a wide table incredibly fast by minimizing disk I/O. It's a poor fit for transactional workloads that need entire rows at once.
Apache ZooKeeper: A Coordinator for Distributed Systems
Think of ZooKeeper as a reliable key-value store for metadata. It provides distributed systems with essentials like configuration management, leader election, and service discovery, ensuring all nodes agree on the system's state.
Audience Analysis: Translate Data for Your Listener
Don't just show data; translate it for your audience. Audience analysis means tailoring communication to who's listening, based on their knowledge and needs. The biggest mistake is assuming your audience shares your context and jargon—they rarely do.

Chartjunk: Less is More in Data Visualization
Chartjunk is visual noise in a graph that doesn't help the user understand the data, like 3D effects or decorative backgrounds. It's common in reports where aesthetics are prioritized over clarity.

Pre-attentive Attributes: Your Brain on Autopilot
Pre-attentive attributes are visual properties your brain processes in milliseconds, before you consciously focus. They're the workhorses of data visualization, making outliers and patterns pop out of a dashboard. The biggest mistake is using too many at once.
Interactive Data Viz: Let Users Explore the Data
Interactive data viz turns a static report into a conversation, giving users controls to ask their own questions. It's key for BI dashboards and research tools. The footgun is overwhelming users with too many options, creating confusion instead of clarity.
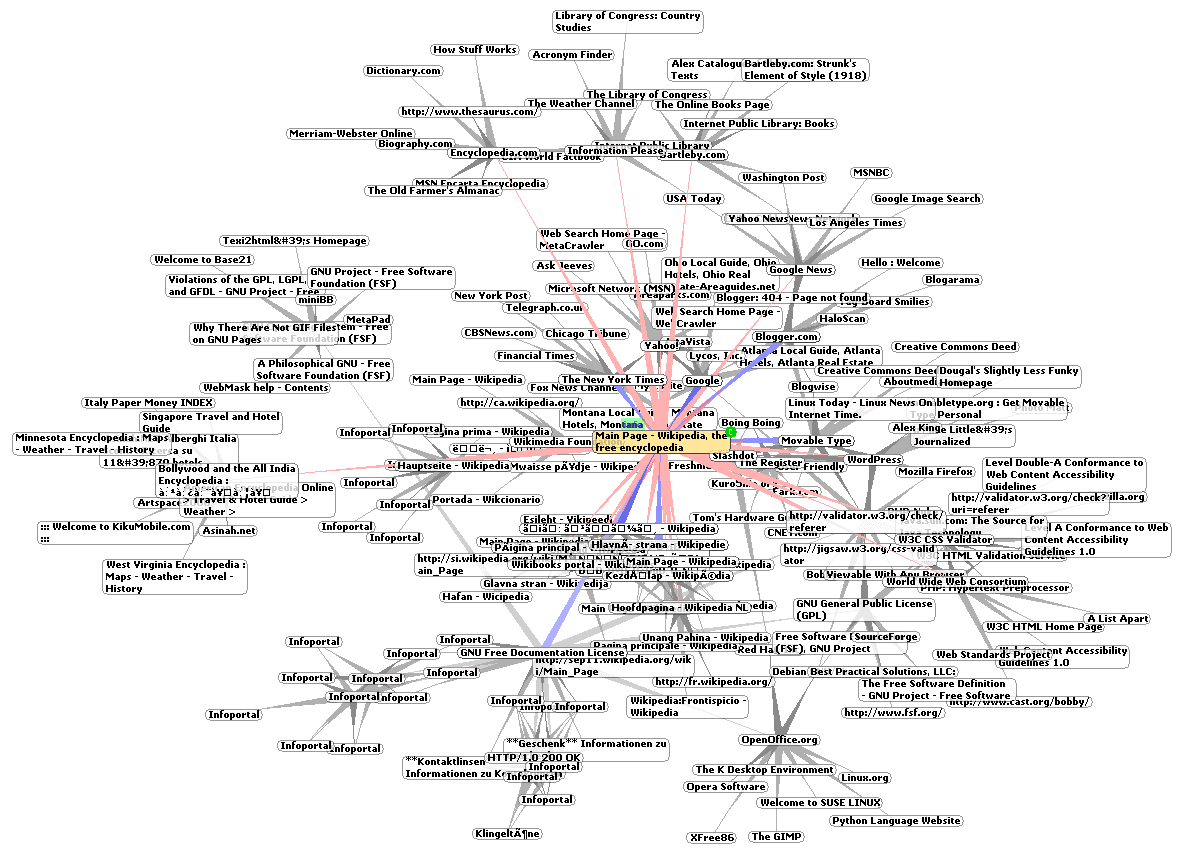
Network Visualization: Making Sense of Connections
Network visualization turns abstract relationships into a 2D map. It's used to see structure in social networks or biological pathways. The footgun is that layout choices can create misleading patterns; a pretty graph isn't always a true one.

Model Versioning: Git for Your ML Models
Think of model versioning as "Git for data." It tracks large models and datasets alongside your code without bloating your Git repo. Use it to reproduce old experiments or roll back to a better-performing model. The footgun is versioning only code, not data.

Model Serving: Turning Trained Models into Live APIs
Model serving wraps a trained machine learning model in an API, making it a live service that can generate predictions. It's how you power features like real-time fraud detection or product recommendations.

Model Cards: The Nutrition Label for AI
A Model Card is a nutrition label for an ML model, detailing its performance, biases, and intended use. It's vital for high-stakes systems to ensure fairness, like in health or legal predictions. The footgun is deploying a model without one, risking misuse.

ML Pipeline: Systematic Model Delivery
A machine learning pipeline is the systematic workflow that carries models from data labeling through deployment inside MLOps. It keeps the AI lifecycle repeatable rather than ad hoc. The footgun is treating a one-off notebook as a production pipeline.

Model Monitoring: A Health Check for Production AI
Model monitoring is a smoke detector for your AI, alerting you when its performance degrades. It compares live data to training data to catch data drift or shifts in user behavior. The footgun is assuming a model, once deployed, performs well forever.
Data Drift: Why Good Models Go Bad
Data drift is when a model's accuracy decays because the real-world data it was trained on has changed. This happens in fraud detection as scams evolve or in e-commerce as trends shift.
We are hiring for this. Every open role lists the topics its interview covers, so you can prepare for the real thing rather than guessing.
See open roles