Concepts in DevOps & Cloud, page 23
cAdvisor: A Task Manager for Containers
cAdvisor is like a task manager for your containers, giving you a live view of their resource usage. It's used to track performance, historical usage, and network stats for every container on a host.
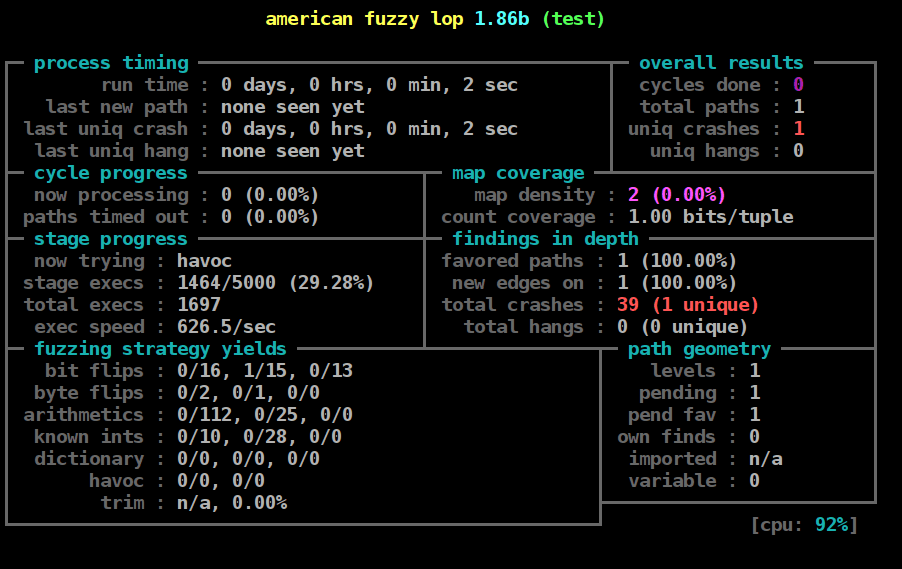
Fuzz Testing: Finding Bugs with Random, Invalid Inputs
Fuzz testing is automated chaos engineering for your inputs. It feeds your program semi-random, invalid data to uncover crashes and security flaws, especially in code that parses files or network protocols.

PromQL: Querying Time Series Data as Vectors
PromQL treats metrics as vectors of values over time, letting you slice and aggregate system state. It's used for Grafana dashboards and Alertmanager rules. The footgun: applying rate() to a gauge instead of a counter produces silent, nonsensical results.
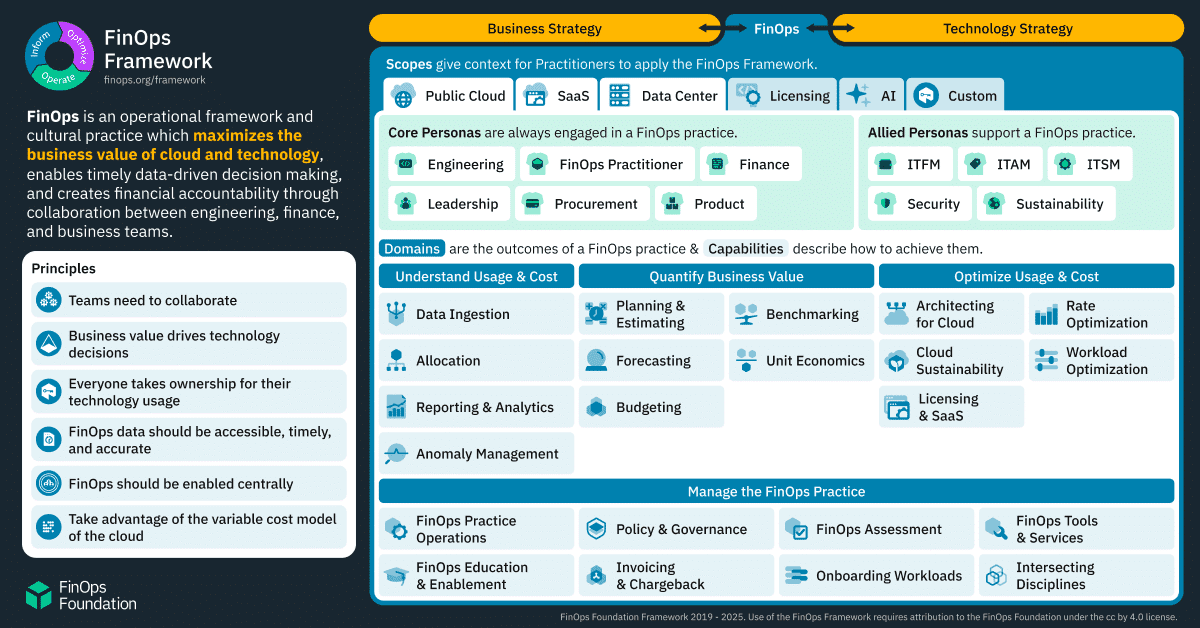
FinOps Framework: Aligning Cloud Cost with Business Value
FinOps treats cloud spend as a business metric, not just an IT cost. It provides a shared framework for engineering, finance, and business to collaborate on data-driven spending decisions.
The Vulnerability Management Lifecycle: A Continuous Loop
Think of vulnerability management not as a one-off task, but a continuous cycle of finding, prioritizing, fixing, and verifying security weaknesses. This process is crucial for securing any system by systematically reducing its attack surface.
Just Culture: Fix the System, Not the Blame
Just Culture treats human error as a system failure, not a personal one. It's key for incident post-mortems, encouraging honest reporting to improve reliability.
Prometheus Alertmanager: Taming Your Alert Storms
Alertmanager is the traffic controller for your Prometheus alerts, turning a potential flood into actionable notifications. It groups, deduplicates, and routes alerts to services like PagerDuty. The footgun: don't load balance traffic to an HA cluster.
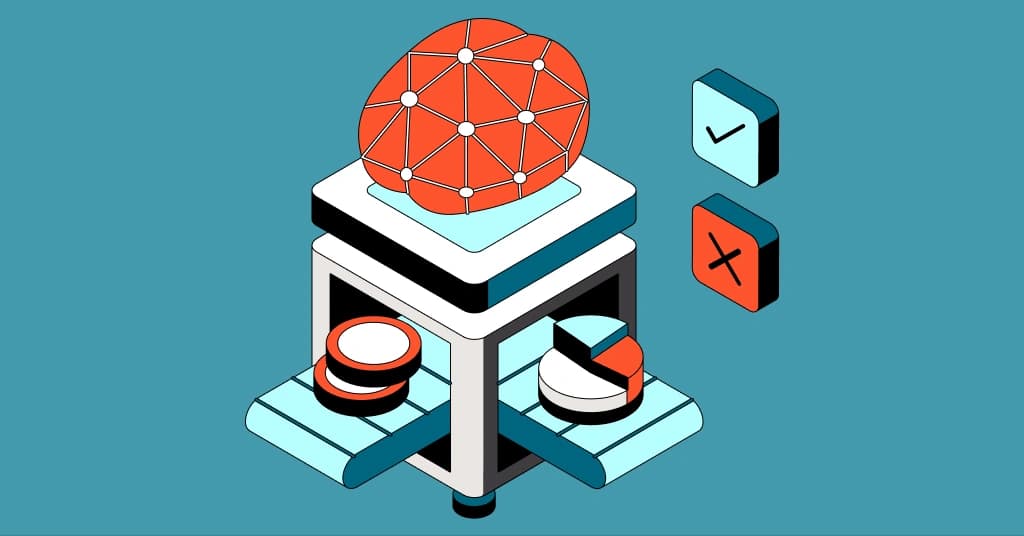
Showback vs. Chargeback: Who Pays the Cloud Bill?
Showback shows teams their cloud costs for visibility; Chargeback makes them pay for it by moving costs to their budget. This helps control cloud spend by making engineers cost-aware. The footgun is treating Chargeback as inherently more mature than Showback.
RASP: An Immune System for Your Application
Think of RASP as an application's immune system, using runtime instrumentation to block attacks from within. It provides real-time protection against threats that static analysis or network firewalls miss.

Customer Reliability Engineering: SRE for Your Customers
CRE extends SRE principles to your customers, making their reliability a shared goal. A provider partners with a key customer to co-engineer resilient services on their platform.
OpenTelemetry
OpenTelemetry is a CNCF standard for generating, collecting and exporting traces, metrics and logs from your services using one vendor neutral set of APIs and SDKs, so you can switch observability backends without rewriting instrumentation code.
Start/Stop Automation: Pay Only For What You Use
Start/stop automation is like putting your cloud resources on a timer to save money. It's essential for non-production environments like dev and staging used only during business hours.
CI/CD and the Principle of Least Privilege
Treat your CI/CD pipeline like a temporary worker, not a superuser. Grant it only the minimum permissions needed for its specific task, like building code or deploying to staging.
The Ironies of Automation: More Automation, More Problems?
Automating a system to reduce human error makes the human's role more critical, not less. The more reliable the automation, the less practice operators get for the rare, high-stakes moment it inevitably fails, leaving them unprepared to take control.

Service Mesh Observability: Seeing Inside the Black Box
A service mesh provides observability by intercepting all service-to-service traffic. It automatically generates logs, metrics, and traces, helping you debug distributed systems without changing application code.
Cost Anomaly Detection: Catching Runaway Cloud Bills
Think of cost anomaly detection as a fraud alert for your cloud bill. It uses machine learning to learn your normal spending patterns and automatically flags unexpected spikes before they become a crisis.
Observability: Seeing Inside Your System
Observability is the ability to ask new questions about your system's health without shipping new code. It's crucial for debugging distributed systems and is the first step in triaging an outage.
APM: Turning System Metrics into Business Meaning
APM turns system metrics into business meaning by tracking software performance and availability. It matters most when slowdowns threaten service levels. The footgun is gathering data without translating IT metrics into what the business actually cares about.
Capacity Planning: Don't Run Out of Room
Capacity planning matches your system's resources to user demand, crucial for handling traffic spikes or budgeting cloud spend. The main footgun is planning for theoretical 'design capacity' instead of realistic 'effective capacity' which accounts for…
GitOps Principles: Your Repo as the Source of Truth
GitOps treats infrastructure state like code, with your Git repo as the single source of truth. Automated agents pull declarative configs from the repo to reconcile the live system, making it ideal for Kubernetes.
We are hiring for this. Every open role lists the topics its interview covers, so you can prepare for the real thing rather than guessing.
See open roles