Intermediate everything in Product Management, page 43
Statistical Significance: Is Your Result Real or Just Random?
Statistical significance checks if a result is a real effect or just random chance. It answers: 'How surprising is this data if my change had no effect?' It's used in A/B tests to validate new features. The footgun: a significant result isn't always important.
Small Multiples: Comparing Data with a Grid of Charts
Small multiples are a comic strip for data, showing different dataset slices in a grid of charts with identical axes. They're used to compare trends across categories, like sales per region. The footgun is using inconsistent scales, which breaks comparison.

Data-Ink Ratio: Maximize Signal, Minimize Noise
The Data-Ink Ratio states that a good chart maximizes the ink showing data and minimizes everything else. It's a call to erase 'chart junk'—heavy gridlines or 3D effects—that doesn't convey information.

Data Visualization: Turning Numbers into Insight
Data visualization turns raw data into pictures, revealing stories that numbers alone can't tell. It's used to spot trends, find outliers, and grasp complex relationships in datasets.

Ad Hoc Reporting: Answering One-Off Business Questions
Ad hoc reporting is your data "quick dive" for one-off questions, unlike static dashboards. A sales team might use it to see how a holiday affected regional sales.
Cross-Tabulation: Finding Relationships in Your Data
Cross-tabulation reveals how two variables are related by counting their joint occurrences in a grid. It's key for survey analysis or A/B testing. The footgun is assuming correlation implies causation; the table shows a relationship, not its cause.
Drill-Down Analysis: From Summary to Specifics
Drill-down analysis moves from a high-level data summary to the granular details composing it. It's used in dashboards to investigate a metric's change, like clicking a monthly sales dip to see daily figures.
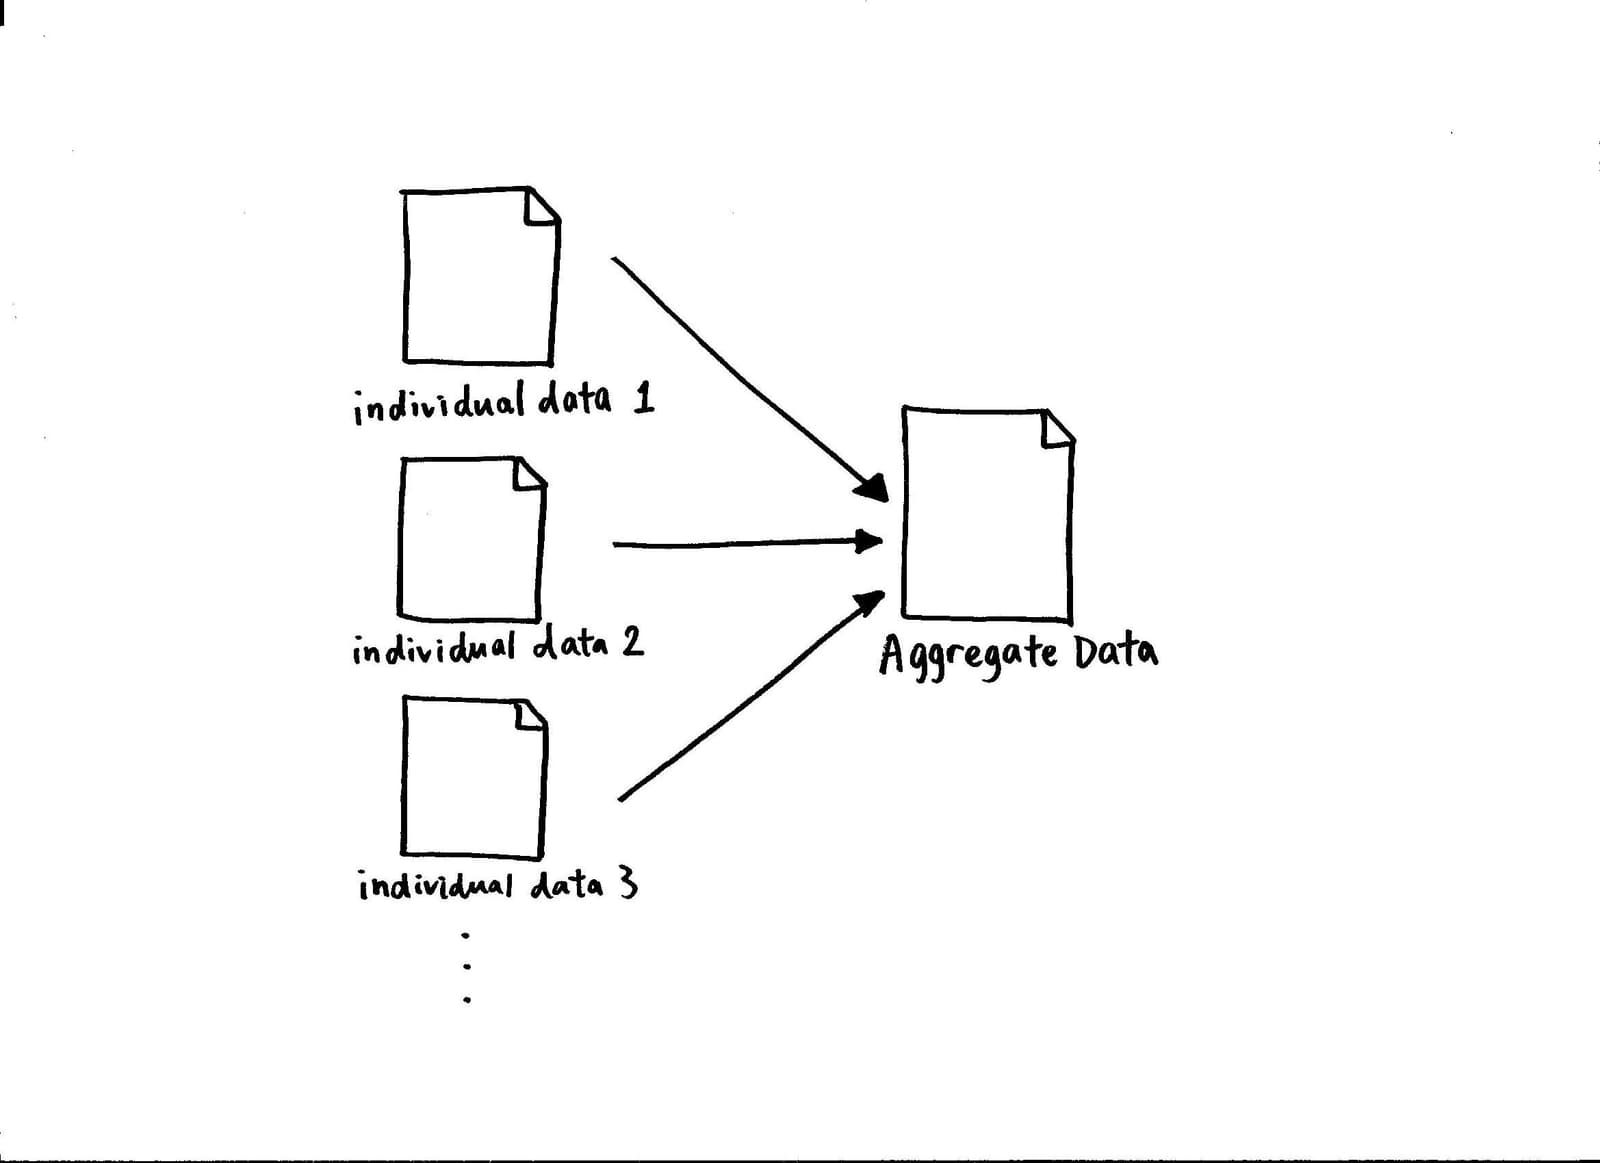
Data Aggregation: The Big Picture from Small Details
Data aggregation rolls up granular records into high-level summaries, like turning individual sales logs into a daily sales report. It's used to power dashboards and speed up warehouse queries.

GDPR: Treating User Data as a Liability, Not an Asset
GDPR treats personal data as a liability borrowed from the user. It gives EU citizens strong rights over their data, like access and erasure, forcing any company processing it to comply. The footgun is assuming it doesn't apply if your company isn't in the EU.
Data Anonymization: Protecting Privacy by Removing PII
Data anonymization breaks the link between data and real people by removing personal identifiers. It’s used to share datasets for research or analytics while protecting privacy.
Data Catalog: The Library Card for Your Data
A data catalog is like a library card catalog for your company's data, telling you what exists, where it lives, and what it means. It helps analysts find trustworthy datasets and engineers trace the impact of schema changes. The footgun is letting it go stale.
Data Lineage: The Story of Your Data
Data lineage is a family tree for your data, showing its origins, transformations, and final destination. It's essential for debugging broken analytics and tracing errors to their source.
Data Quality: Is Your Data Fit for Purpose?
High-quality data is defined by its fitness for a specific purpose, not just its correctness. It must accurately represent the real world. This is critical for business planning or ML models.
Data Profiling: The First Step in Any Data Project
Data profiling creates a 'character sketch' of a dataset, revealing its structure, content, and quality. It's the first step in data warehousing or analytics to discover metadata and assess risks. The footgun is skipping it, leading to late-project surprises.
Change Data Capture (CDC): Turn Your Database Into a Stream
Change Data Capture (CDC) turns your database into a real-time stream of change events (inserts, updates, deletes). It's used to sync data across systems, like updating search indexes or feeding analytics warehouses, without full table scans.
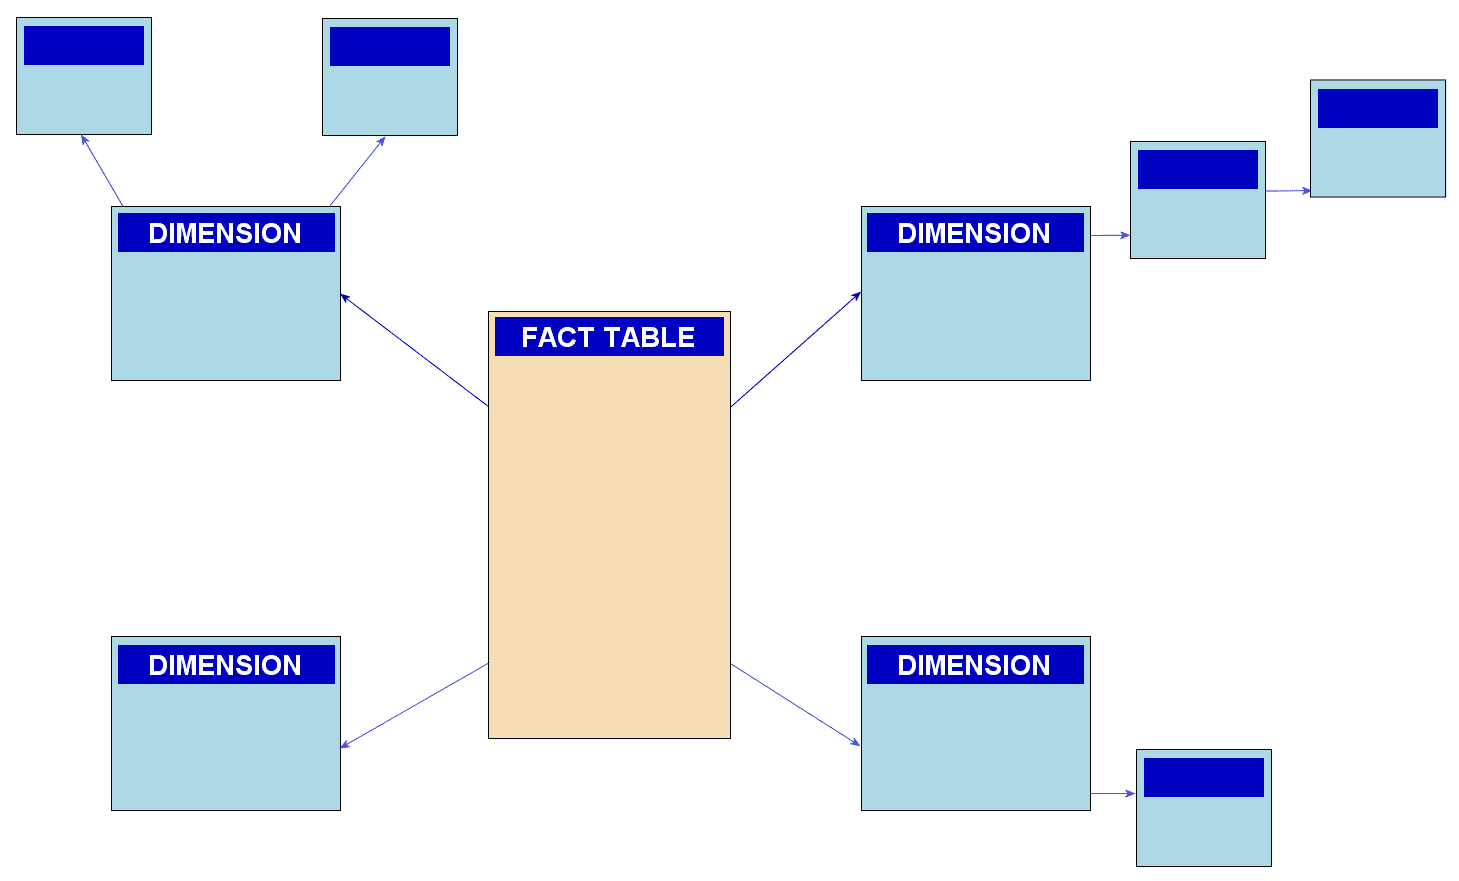
Snowflake Schema: Trading Query Speed for Storage
A snowflake schema saves storage by normalizing a star schema's dimensions into smaller, related tables. It's used in data warehouses to reduce redundancy, but the extra joins required can slow down queries, making it a trade-off against a simpler star schema.
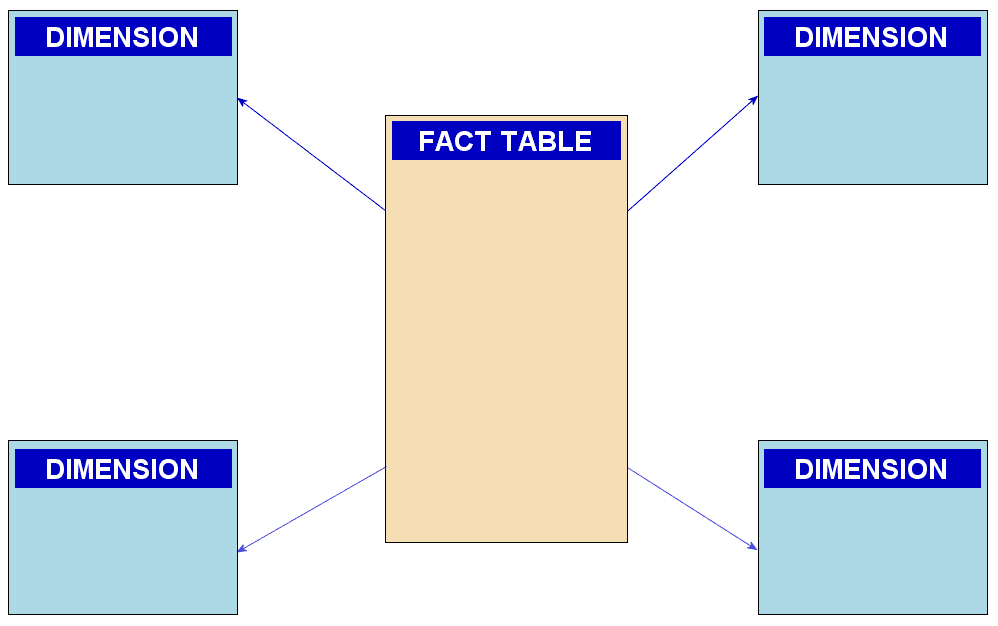
Star Schema: The Blueprint for Analytics Data
A star schema organizes analytics data with a central fact table (e.g., sales) surrounded by dimension tables (e.g., customers). It's built for fast queries in data warehouses. The footgun is normalizing dimensions, which negates its speed advantage.

Data Marts: Your Department's Slice of the Data Warehouse
Think of a data mart as a department's personal slice of the main data warehouse, containing only relevant data. This allows teams like Sales or Marketing to run faster, focused queries. The footgun is letting each team define shared terms differently.
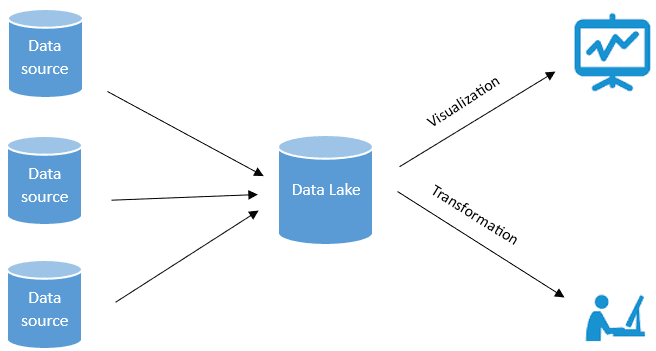
Data Lake: Store Raw Data Now, Analyze It Later
A data lake is a central repository that holds vast amounts of raw data in its native format. This "store now, structure later" approach is ideal for machine learning on original, unfiltered source data.
Event Autocapture: Low-Effort Frontend Analytics
Event autocapture is like a security camera for your UI, recording all user interactions automatically. It's used in web analytics to capture clicks and page views with minimal setup, letting you analyze behavior without manually instrumenting every button.
We are hiring for this. Every open role lists the topics its interview covers, so you can prepare for the real thing rather than guessing.
See open roles