All bites
The whole library, newest first. Filter by what you are here for, or pick a topic if you already know.
4330 bites
Page 118
What is the 'novelty effect' in experimentation?
Tests whether you separate temporary curiosity from durable value. A strong answer defines novelty effect as short-term behavior change triggered by new elements, notes it inflates early experiment lift, and proposes longer runtimes or lagged cohort analysis.
What is the novelty effect in experimentation?
This tests your grasp of temporary user behavior changes that can invalidate A/B tests. A strong answer defines the effect, explains how it inflates metrics, and suggests running tests longer or segmenting by user tenure. A red flag is ignoring mitigation.
Handling the novelty effect in experimentation
This tests your grasp of second-order effects in A/B testing. A great answer defines the novelty effect, explains how it inflates initial metrics, and suggests mitigating it by running tests longer or segmenting by user tenure. A red flag is ignoring it.

What is the difference between a primary metric and a guardrail metric?
Tests whether you distinguish success criteria from safety checks in experiments. A strong answer defines primary metrics as the target outcome, guardrails as protective thresholds, and gives a concrete scenario where a primary lift does not justify shipping…
Primary vs. Guardrail Metrics in Experiments
Tests your grasp of risk management in A/B testing. A great answer defines a primary metric as the goal and a guardrail as a 'do no harm' check. A feature ships only if the primary improves without hurting guardrails.
Primary vs. Guardrail Metrics in Experiments
This tests if you can balance improving a key metric with not harming the user experience. Define primary (the goal) and guardrail (don't harm) metrics. Give an example where a guardrail regression (e.g., latency) blocks a feature ship.
Why is user-level randomization flawed by spillover and what is an alternative?
Network interference. A/B tests violate SUTVA when treatment spills across edges, biasing effects. Cluster randomization uses network clusters and Horvitz-Thompson weighting for unbiased estimates.
Why is user-level randomization flawed by spillover effects?
Tests your grasp of SUTVA violations in network experiments. Explain how spillover contaminates the control group, then propose graph cluster randomization—grouping users and assigning entire clusters to A/B variants—to minimize interference.
Handling spillover effects in social network A/B tests
This tests your grasp of SUTVA violations in networked experiments. A great answer explains how user-level randomization causes spillover, then proposes graph cluster randomization to assign entire communities to treatment or control, minimizing…

Explain how CUPED increases statistical power and required data
Tests ANCOVA variance reduction. Answer: CUPED regresses pre-experiment X on Y, shrinking variance by (1-ρ²); needs pre-randomization prognostic baseline; beats difference scores. Red flag: calling it Y-X subtraction or saying it changes the effect.
How CUPED increases statistical power in experiments
Tests your grasp of variance reduction in A/B testing. Explain how CUPED uses correlated pre-experiment data to reduce outcome variance, increasing statistical power. A red flag is confusing it with simpler difference scores, which can actually increase noise.
How does CUPED increase the statistical power of an experiment?
Tests your grasp of variance reduction. Explain CUPED as ANCOVA, using pre-experiment data (X) to remove predictable noise from the outcome (Y). Effectiveness depends on correlation (rho), reducing variance by (1-rho^2).
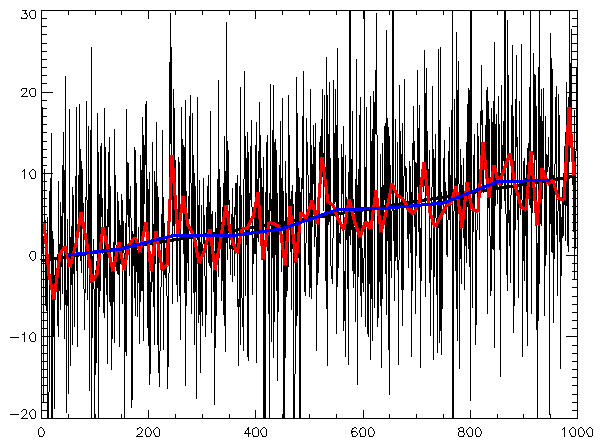
Describe key components for EDA on three years of daily user sign-ups
This tests time-series decomposition intuition. A strong answer covers trend, seasonality, and noise via plots, autocorrelation, and calendar effects, plus checks for missing days and outliers. Red flag: jumping to forecast models before validating structure.
How would you analyze a time series of user sign-ups?
This tests your structured approach to decomposing time series data. A strong answer identifies trend (long-term growth), seasonality (weekly/yearly patterns), and irregular components like spikes or dips.
Describe EDA for a 3-year daily user sign-up dataset.
Tests your structured approach to time series EDA. A good answer identifies trend, seasonality, and anomalies before modeling. A red flag is jumping to forecasting models or only mentioning the overall average growth, ignoring cyclical patterns.

How do you measure forecast accuracy and compare MAE to RMSE?
This tests out-of-sample validation and how MAE and RMSE weight errors. A strong answer demands a train-test split, defines both, and notes RMSE punishes outliers more while MAE is more robust. A red flag is citing in-sample fit instead of held-out error.
How would you measure a sales forecast model's accuracy?
Tests if you can link statistical metrics to business outcomes. Define MAE (average error) and RMSE (penalizes large errors). Choose RMSE when large misses are costly (e.g., stock-outs), MAE otherwise. A red flag is reciting formulas without business context.
How would you measure a sales forecast model's accuracy?
This tests your ability to connect statistical metrics to business impact. A great answer defines MAE (linear error cost) and RMSE (penalizes large errors), explains the choice depends on business context, and stresses using a test set.
Stationarity in time series and why ARIMA needs it
Constant mean/variance/autocovariance; ARIMA's coefficients assume them; test with the ADF test and ACF plots; achieve it via differencing or log transforms.
Explain time series stationarity and how to achieve it
Tests your grasp of core time series assumptions. Define stationarity (constant mean/variance over time), explain why models need it for stable predictions, and name methods to test and achieve it. A red flag is just saying the data looks 'flat'.