All bites
The whole library, newest first. Filter by what you are here for, or pick a topic if you already know.
8668 bites
Page 231
How do you measure impact while accounting for the novelty effect?
Tests your ability to design experiments that isolate long-term effects. A good answer proposes a long-running A/B test, analyzing user cohorts by join date to see if initial lift decays. A red flag is ignoring the novelty effect and suggesting a short test.
Design a Real-Time Analytics Pipeline for Mobile Events
Tests your grasp of low-latency, high-throughput design. A strong answer outlines ingestion (Kafka), stream processing (Flink), and a real-time OLAP database (Druid/ClickHouse). A red flag is proposing a slow, batch-only architecture.

Design a data warehouse model for tracking feature adoption
This tests your grasp of data warehousing star schemas for efficient behavioral analysis. A strong answer proposes a central events fact table linked to users, features, and time dimension tables.

Explain cohort analysis for user retention and write a pseudo-query
Tests your ability to use precise metrics. A good answer defines a cohort, explains why it isolates variables better than aggregate data, outlines the calculation, and provides a clear pseudo-query.

Track an 'Export to CSV' button's usage and outcomes
This tests your ability to design a robust event schema, not just track a click. A great answer uses one custom event name with a 'status' parameter ('initiated', 'success', 'failure'). A red flag is suggesting multiple event names for one action.
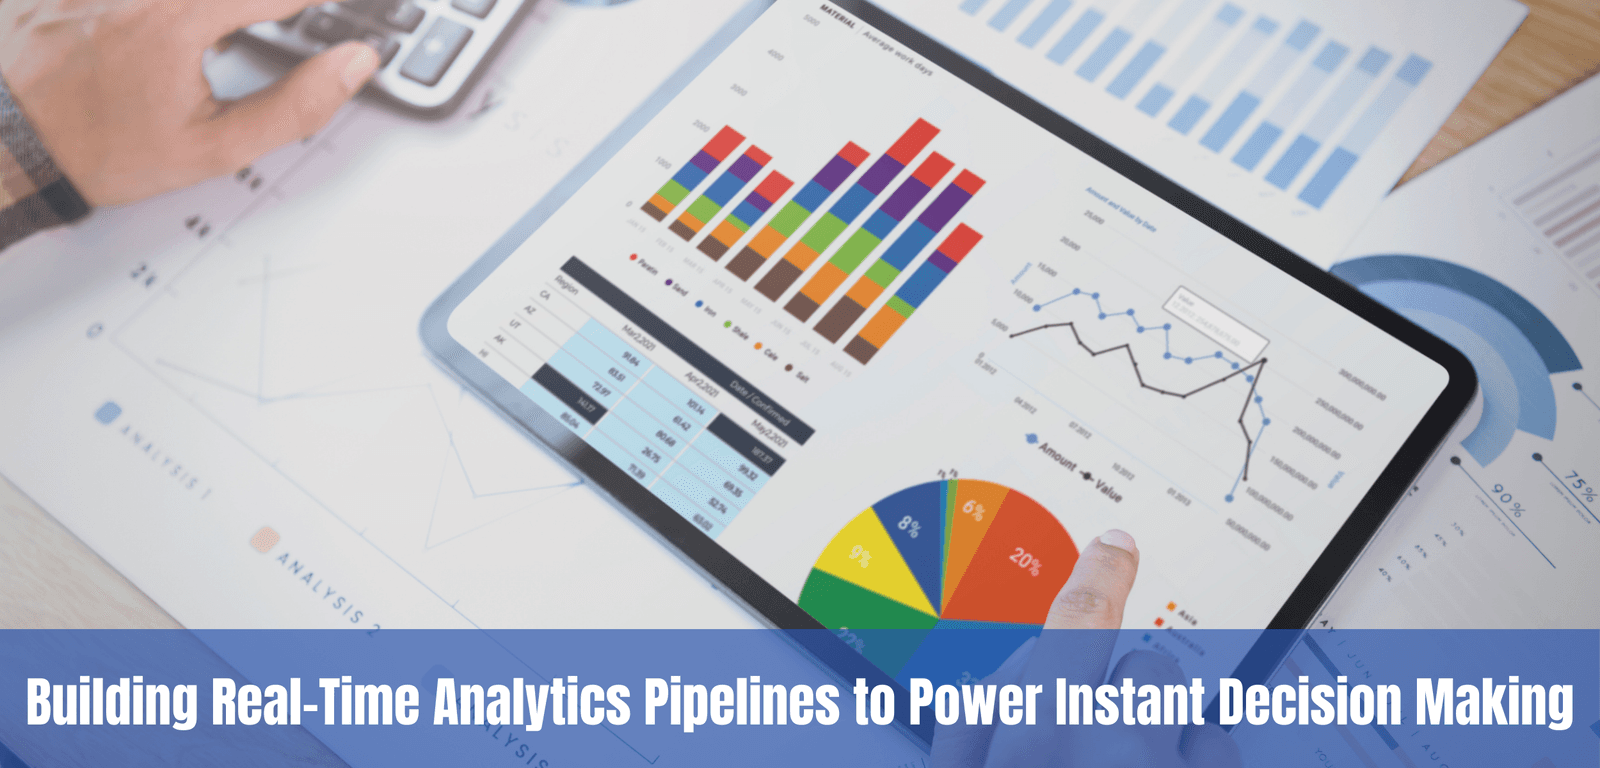
Design a near real-time analytics pipeline for a critical metric
This tests your grasp of stream processing trade-offs (latency, cost, correctness). Outline a 4-stage pipeline (ingest, process, store, visualize) with specific tech choices, contrasting its low-latency, high-cost nature with batch.
How would you optimize a slow, expensive data warehouse?
Tests your diagnostic approach to performance issues. A good answer first analyzes query patterns, then applies partitioning by date, clustering by high-cardinality keys, and materialized views for aggregations.
Explain event schemas and the purpose of a schema registry
This tests your grasp of data governance in event-driven systems. A good answer defines a schema as a contract, a registry as the enforcer, and then details specific downstream failures like broken pipelines and bad analytics. A red flag is being too vague.
How would you design a data model for a feature adoption dashboard?
Tests applying dimensional modeling to a business need. A good answer defines a central fact table (e.g., feature_usage) and related dimensions (user, feature, date). A red flag is designing a transactional model or being too vague about the schema.

Describe dbt's role in a modern analytics stack
Tests your grasp of the ELT paradigm and applying software engineering principles to data. A good answer defines dbt as the 'T' in ELT, contrasts its in-warehouse SQL approach with traditional ETL, and clarifies its relationship with orchestrators like…

Track a user event from frontend code to a BI tool
Tests your understanding of the modern data stack. A good answer traces the event from frontend capture, through an ingestion pipeline, into a data warehouse, and finally to a BI tool for analysis. A red flag is describing only one part of the journey.

Prove API Latency Affects User Engagement
This tests your ability to design a controlled experiment for a backend attribute. A great answer outlines an A/B test that artificially adds latency for a treatment group, details the necessary logging with shared IDs, and explains how to join and analyze…
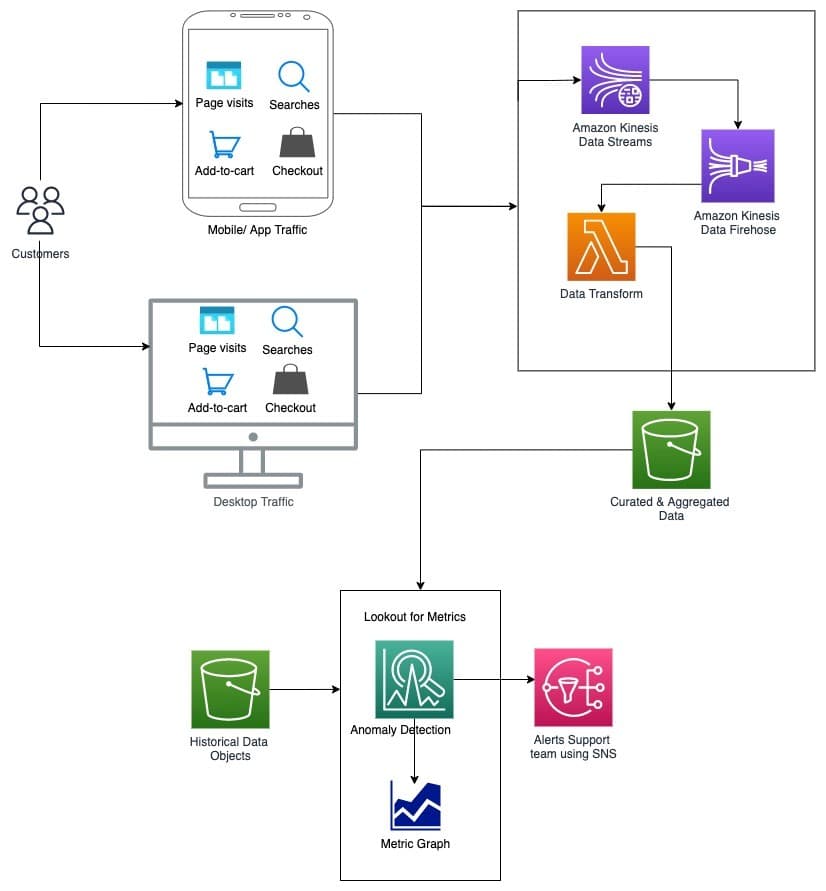
Design a real-time anomaly detection system for 'add to cart' events
Tests real-time data pipeline design and nuanced anomaly detection. A good answer outlines ingestion (Kinesis), processing (Lambda/Flink), seasonal modeling for 'a drop', and alerting (SNS).
How would you measure P95 latency by geographic region?
Tests your ability to design a practical metrics pipeline, considering instrumentation, data types (metrics vs. logs), and aggregation. Instrument the API with a histogram metric and a region label, then query using histogram_quantile.
How would you capture and persist UTM parameters for attribution?
Tests your grasp of state management and data persistence for analytics. A good answer covers capturing UTMs with JS, persisting them in a cookie, and associating them with a user record on the server during a conversion event.
Describe the client-side event for an 'Add to Cart' button
This tests your ability to design analytics events for future analysis. Name a standard event like add_to_cart and list item parameters (item_id, price, quantity).

Describe two methods for generating prediction intervals
This tests your understanding of forecast uncertainty. Describe two methods: 1) assuming normally distributed errors and using a standard deviation multiplier, and 2) bootstrapping residuals to simulate future paths.
How do you handle model performance degradation over time?
This tests MLOps lifecycle awareness. Name concept drift, outline a systematic diagnosis of data and error patterns, discuss retraining strategies, and propose a monitoring plan. A red flag is just saying 'retrain the model' without any diagnosis.

Forecasting inventory with trend and weekly seasonality?
This tests mapping a business problem to a statistical tool. A good answer names Holt-Winters, explains its level, trend, and seasonal components, and discusses additive vs. multiplicative seasonality.
Train-test split vs. time-series cross-validation?
Tests if you see why temporal data breaks random splits. Contrast random sampling with sequential 'walk-forward' validation, where you only use past data to predict the future.