All bites
The whole library, newest first. Filter by what you are here for, or pick a topic if you already know.
8668 bites
Page 230
Client-side vs. Server-side Event Tracking: When and Why?
This tests your grasp of data reliability and security trade-offs. A good answer defines both, contrasts reliability (ad blockers) vs. implementation ease, and uses a critical event like "Payment Processed" to justify server-side's accuracy.

Architect a Multi-Touch Attribution System
This tests your grasp of modern data challenges like signal loss. A good answer discusses data ingestion, identity resolution, and model trade-offs. A red flag is focusing only on the algorithm and ignoring the data pipeline's fragility.

Calculate a 3-step user onboarding funnel with SQL
Tests your ability to translate a business need into a robust data query. A great answer clarifies funnel logic (attribution, timing), defines the user cohort, finds each user's first event for each step, and then calculates conversion.

Implement an A/B test for a new checkout flow
This tests your ability to design a robust, stateful system for experimentation and data analysis. A great answer details user bucketing, consistent variant assignment across devices, and the SQL query structure for analysis.

What is the 'multiple comparisons problem' in A/B testing?
Tests your grasp of statistical pitfalls in large-scale A/B testing. Define the problem (inflated false positives), explain the business risk (wasted effort), and propose a mitigation like Bonferroni correction.

Visualizing Load Time vs. Session Duration with a Third Variable
Tests your ability to visualize correlation and add dimensions. A great answer suggests a scatter plot for the initial relationship, then uses color to segment by the categorical third variable (network type).
.png&w=1600&q=75)
Cohort Analysis for a New Onboarding Flow
Tests applying analytics to measure impact. Define a cohort, then compare a pre-launch (Dec) vs. post-launch (Jan) acquisition cohort, tracking retention over time. A red flag is using aggregate metrics, which hide the true impact of the change.

How would you visualize a complex, multi-stage user funnel?
Tests product sense and data viz literacy. A good answer proposes a Sankey/Alluvial diagram to show non-linear flows, explains how it visualizes drop-off and re-entry, and notes the data needs. A red flag is just suggesting a better standard funnel chart.
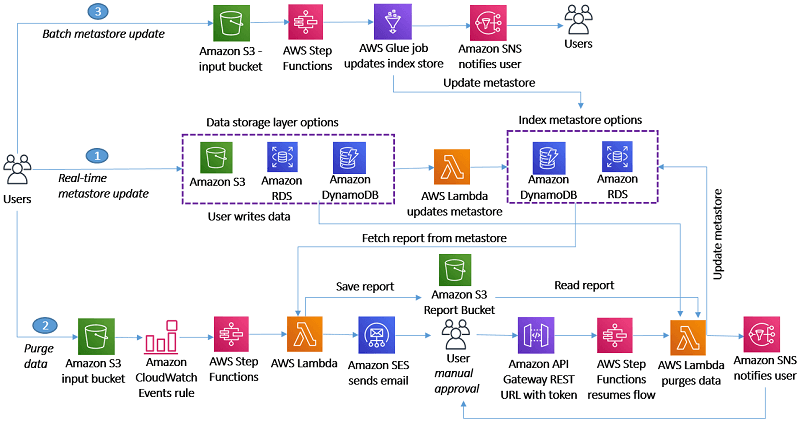
Design a GDPR 'Right to be Forgotten' System
Tests your ability to design a verifiable data deletion system. A good answer outlines an index metastore, an orchestrated workflow, and auditing. A red flag is focusing only on the primary database, ignoring the data lake, warehouse, and caches.
Design an analytics event payload for a button click
This tests your data modeling for analytics. A good answer includes the event name, user ID, and timestamp, then adds contextual and user properties. A red flag is forgetting the user ID or suggesting dynamic property names, which breaks segmentation.

Describe AARRR and apply it to B2B vs. B2C analytics
Tests applying the AARRR framework to different business models. Define AARRR, then apply to B2B SaaS (account-level activation) vs. a B2C game (user-level virality). Red flag: using generic metrics that ignore the context of B2B sales vs. B2C usage.

What's the difference between a metric and a KPI?
This tests your ability to connect technical measurements to strategic business outcomes. A great answer defines both, notes KPIs are a subset of metrics tied to goals, and gives a concrete example like page views (metric) vs. conversion rate (KPI).
Design a Column-Level Data Lineage System at Scale
This tests your ability to design for metadata at scale. A great answer outlines automated collection (parsing/instrumentation), storage in a graph database, and APIs for impact analysis.

Investigate a 20% drop in a key revenue metric
This tests your ability to lead a high-pressure investigation. A great answer confirms the drop, traces data from dashboard to source, and differentiates bugs from business trends. A red flag is jumping to conclusions without a systematic, layered approach.
Design a self-service analytics platform for non-technical users
Tests your ability to design a layered system for non-technical users. A great answer outlines a semantic layer for data modeling, a no-code UI for exploration, and a query generation engine.

Describe the architecture of an A/B testing framework
This tests your system design skills for experimentation, from user bucketing to statistical analysis. A good answer covers user assignment, a config service, a data pipeline, and a results layer with statistical significance.
Design a Data Quality Monitoring & Alerting System
This tests translating business needs into a concrete data validation strategy. A good answer defines checks based on business impact (freshness, volume, schema), then outlines a tiered alerting system. A red flag is naming tools before defining the problem.

Design a Centralized Metrics Layer
This tests your grasp of data governance and creating a single source of truth. A good answer defines a semantic layer between the data warehouse and BI tools, centralizing metric definitions in code.
Instrumenting a New User Interaction for Analytics
Tests your grasp of the full data lifecycle. A good answer covers event definition, client-side implementation, the backend pipeline, and end-to-end verification.
How would you build a weekly active user dashboard?
This tests your ability to translate a business request into a technical plan. A good answer defines "active," identifies necessary data (user ID, timestamp, event), outlines the data modeling, and explains the BI tool implementation.