All bites
The whole library, newest first. Filter by what you are here for, or pick a topic if you already know.
8668 bites
Page 232
Explain stationarity in a time series
This tests your grasp of core time series modeling assumptions. A strong answer defines stationarity (constant mean/variance), explains its importance for ARIMA (stable patterns), and names a test (ADF) and a fix (differencing).

How would you measure a sales forecast model's accuracy?
This tests your ability to connect statistical metrics to business impact. A great answer defines MAE (linear error cost) and RMSE (penalizes large errors), explains the choice depends on business context, and stresses using a test set.

Describe EDA for a 3-year daily user sign-up dataset.
Tests your structured approach to time series EDA. A good answer identifies trend, seasonality, and anomalies before modeling. A red flag is jumping to forecasting models or only mentioning the overall average growth, ignoring cyclical patterns.

How does CUPED increase the statistical power of an experiment?
Tests your grasp of variance reduction. Explain CUPED as ANCOVA, using pre-experiment data (X) to remove predictable noise from the outcome (Y). Effectiveness depends on correlation (rho), reducing variance by (1-rho^2).
Handling spillover effects in social network A/B tests
This tests your grasp of SUTVA violations in networked experiments. A great answer explains how user-level randomization causes spillover, then proposes graph cluster randomization to assign entire communities to treatment or control, minimizing…

Primary vs. Guardrail Metrics in Experiments
This tests if you can balance improving a key metric with not harming the user experience. Define primary (the goal) and guardrail (don't harm) metrics. Give an example where a guardrail regression (e.g., latency) blocks a feature ship.
Handling the novelty effect in experimentation
This tests your grasp of second-order effects in A/B testing. A great answer defines the novelty effect, explains how it inflates initial metrics, and suggests mitigating it by running tests longer or segmenting by user tenure. A red flag is ignoring it.

Why is stopping an A/B test when it hits significance problematic?
Tests your understanding of the 'peeking problem' in A/B testing. A great answer defines peeking, explains how it inflates the Type I error rate (false positives), and states the need for a predetermined sample size.

How do you determine A/B test sample size and duration?
This tests your ability to connect business goals to statistical parameters. A good answer defines the four power analysis inputs (baseline, MDE, alpha, power) and explains trade-offs, then converts sample size to duration using business cycles.
How would you A/B test a 'Buy Now' button color change?
This tests structured thinking. A good answer defines a hypothesis, selects primary and guardrail metrics, and outlines the experiment's duration and analysis plan. A red flag is focusing only on clicks without considering business impact.
Why not t-test p99 latency? Describe a valid alternative.
This tests your grasp of statistical test assumptions. A good answer explains why p99 violates t-test normality, then outlines a resampling method like bootstrapping to build a confidence interval on the *difference* of p99s.

Explain Simpson's Paradox with a user engagement example
This tests your understanding of statistical pitfalls in A/B testing. A good answer defines the paradox, gives an example where a feature fails in aggregate but wins in every segment, and attributes it to a confounding variable.
How to Statistically Test a 10% DAU Drop?
Tests your knowledge of hypothesis testing. A good answer outlines the steps: state a null hypothesis, choose a test (e.g., Z-test), calculate a p-value, and compare it to a significance level (alpha).
Explain the difference between correlation and causation
Tests if you can avoid statistical fallacies. First, define correlation (association) and causation (cause-effect). Then, explain the difference via a confounding variable. A red flag is giving an example where one metric actually could cause the other.
p-value is 0.08, significance is 0.05. Ship it?
This tests your ability to translate statistical risk for business partners. Explain that p=0.08 means an 8% chance of a false positive, quantify the cost of a bad decision, and suggest extending the test to increase power.
What does a p-value of 0.03 mean in an A/B test?
Tests your practical statistical literacy. A good answer defines the p-value (3% chance of this result if the null is true), compares it to alpha (0.03 < 0.05) to reject the null, and decides to ship.
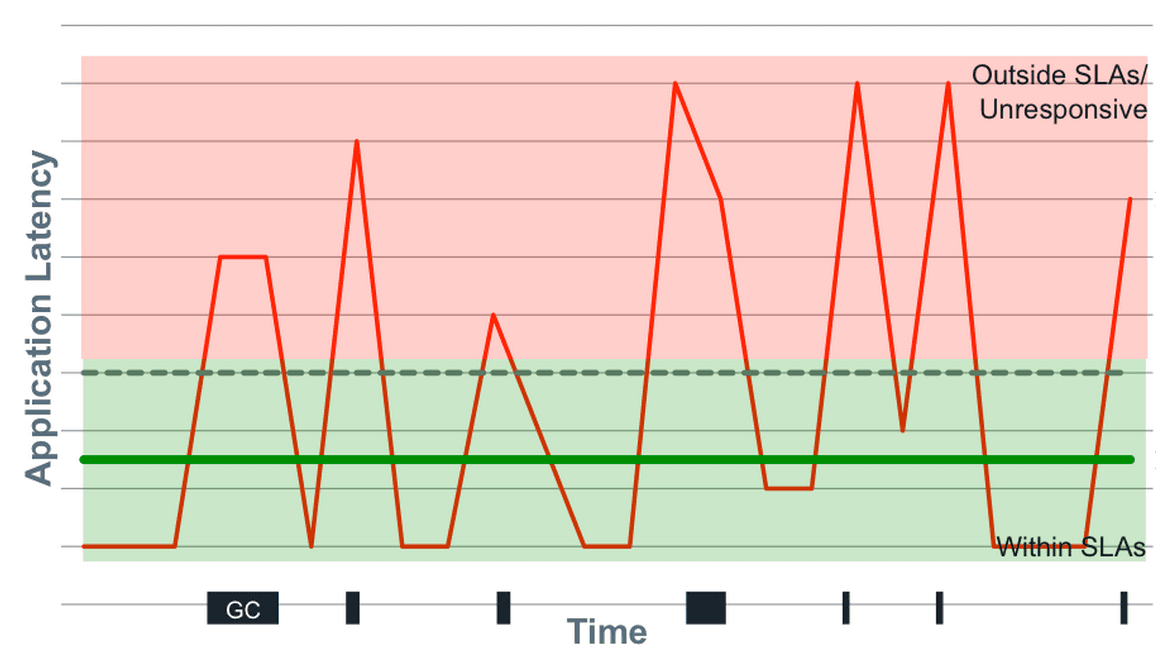
Mean vs. Median for API Response Times?
Tests if you know latency data has outliers. A good answer chooses median because it's robust to extremes. Explain that mean gets skewed by a few slow requests (e.g., GC pauses), hiding the typical user experience.

How would you architect a fast, multi-dimensional analytics dashboard?
This tests your grasp of analytics architectures and trade-offs between pre-computation and real-time querying. A great answer clarifies needs, then proposes a hybrid model using an OLAP cube for core metrics and a columnar store for ad-hoc queries.
How would you validate a PM's claim about feature success?
This tests your grasp of causal inference vs. correlation. A great answer acknowledges self-selection bias, proposes a quasi-experimental method like Propensity Score Matching to create a synthetic control group, and then compares outcomes for the matched…
An A/B test has imbalanced traffic. What do you do?
This tests your ability to spot confounding variables and Simpson's Paradox. A good answer first invalidates the aggregate result, then proposes segmenting by device to salvage insights, and finally investigates the root cause.