Intermediate interview questions in Analytics & Metrics, page 8
Design an analytics event payload for a button click
This tests your data modeling for analytics. A good answer includes the event name, user ID, and timestamp, then adds contextual and user properties. A red flag is forgetting the user ID or suggesting dynamic property names, which breaks segmentation.
Enforcing GDPR Right to be Forgotten at scale
Map the subject's data, then crypto-shred the lake, DELETE in the warehouse, and evict caches via an auditable, idempotent workflow.
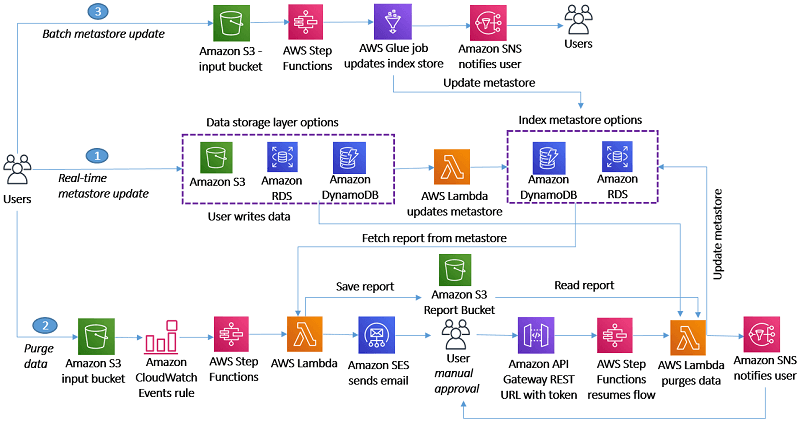
Enforce GDPR's Right to be Forgotten Across a Complex Architecture
This tests your design of a verifiable, async deletion workflow. A strong answer proposes a central index metastore, an orchestrated workflow (e.g., Step Functions) for deletion, and an auditing layer.
Design a GDPR 'Right to be Forgotten' System
Tests your ability to design a verifiable data deletion system. A good answer outlines an index metastore, an orchestrated workflow, and auditing. A red flag is focusing only on the primary database, ignoring the data lake, warehouse, and caches.
Visualizing a non-linear funnel with re-entry
A linear funnel cannot show branching or re-entry; a Sankey diagram encodes flow volume, splits, and leaks as proportional ribbons.

How to visualize a complex, multi-stage customer funnel?
Tests your ability to choose the right visualization for non-linear user flows. Propose a Sankey or Alluvial diagram to show flow volume, drop-off, and re-entry. A red flag is suggesting multiple simple charts that fail to show the paths between stages.
How would you visualize a complex, multi-stage user funnel?
Tests product sense and data viz literacy. A good answer proposes a Sankey/Alluvial diagram to show non-linear flows, explains how it visualizes drop-off and re-entry, and notes the data needs. A red flag is just suggesting a better standard funnel chart.
Cohort analysis for an onboarding change
A cohort groups users by a shared start trait; compare pre and post Jan-1 signup cohorts on retention by age.
.png&w=1600&q=75)
Set up a cohort analysis for a new onboarding flow
This tests your ability to design a clean experiment to measure product impact. A great answer defines control/treatment cohorts by acquisition date (before/after Jan 1st), picks a specific metric like W1 retention, and compares them.
Cohort Analysis for a New Onboarding Flow
Tests applying analytics to measure impact. Define a cohort, then compare a pre-launch (Dec) vs. post-launch (Jan) acquisition cohort, tracking retention over time. A red flag is using aggregate metrics, which hide the true impact of the change.
Visualizing a correlation with a third variable
A scatter plot with a trend line shows the relationship; encode network type by color or facets to expose a lurking variable.

Visualize Correlation Between Load Time and Session Duration
Tests your ability to choose the right chart for correlation and layer in additional variables. A great answer starts with a scatter plot (load time vs. session duration), then uses color to represent the network type.
Visualizing Load Time vs. Session Duration with a Third Variable
Tests your ability to visualize correlation and add dimensions. A great answer suggests a scatter plot for the initial relationship, then uses color to segment by the categorical third variable (network type).
The multiple comparisons problem in A/B testing
Many tests at alpha 0.05 inflate the chance of a false positive; mitigate with Bonferroni or FDR control plus pre-registered metrics.

How do you handle the multiple comparisons problem in A/B testing?
Tests your grasp of statistical risk in experimentation. Explain how multiple tests inflate false positives, then describe mitigations like Bonferroni correction or limiting concurrent tests. A red flag is suggesting total test isolation, which is impractical.
What is the 'multiple comparisons problem' in A/B testing?
Tests your grasp of statistical pitfalls in large-scale A/B testing. Define the problem (inflated false positives), explain the business risk (wasted effort), and propose a mitigation like Bonferroni correction.
Implementing a consistent-assignment A/B test
Need an assignment service, exposure logging, and event tracking; ensure stickiness by hashing a stable user id; analyze conversion per variant.

Implement an A/B test for a new checkout flow
Tests your grasp of the full A/B testing lifecycle. A great answer outlines a feature flag system, consistent user bucketing via hashing a stable user ID, and an analytics query grouping by variant. A red flag is suggesting simple client-side randomization.
Implement an A/B test for a new checkout flow
This tests your ability to design a robust, stateful system for experimentation and data analysis. A great answer details user bucketing, consistent variant assignment across devices, and the SQL query structure for analysis.
SQL for a three-step onboarding funnel
Anchor the 30-day signup cohort, count distinct users reaching each later step in timestamp order; conversion is each step over the prior.
We are hiring for this. Every open role lists the topics its interview covers, so you can prepare for the real thing rather than guessing.
See open roles