Advanced everything in Analytics & Metrics, page 3
Why can't we t-test p99 latency in an A/B test?
This tests if you know why t-tests fail for percentiles. A t-test requires a normally distributed statistic (like the mean), but a sample p99's distribution isn't normal.

Design a Fast, Multi-Dimensional Analytics Dashboard
This tests your grasp of data warehousing trade-offs for analytics. A great answer compares OLAP cubes (fast, pre-computed) vs. columnar DBs (flexible, real-time), then proposes a hybrid model.
How would you validate a feature's success, correcting for self-selection?
This tests your ability to separate correlation from causation. A great answer identifies self-selection bias, proposes a quasi-experimental method like Propensity Score Matching to create a control group, and then compares outcomes.
How would you visually represent statistical uncertainty in a chart?
This tests your ability to accurately communicate statistical significance. A great answer discusses error bars (with 95% CIs), then more advanced options like gradient or violin plots, and frames the choice by audience.
Strategy for Visualizing Millions of Time-Series Points
Tests your strategy for balancing performance and visual fidelity with large datasets. Propose backend downsampling with an algorithm like LTTB to preserve peaks, then discuss multi-resolution data fetching on the frontend.

How do you manage schema evolution in an analytics pipeline?
This tests your grasp of data as a contract. A great answer covers schema registries, backward compatibility, and a phased rollout from producer to warehouse. A red flag is only mentioning an ALTER TABLE command, ignoring the entire data pipeline.
Challenges of Grouping by High-Cardinality Dimensions
This tests your grasp of system-level impacts of data shape. A good answer explains how high cardinality strains memory during aggregation, reduces compression, and inflates index size, leading to slow, expensive queries. A red flag is just saying 'it's slow'.
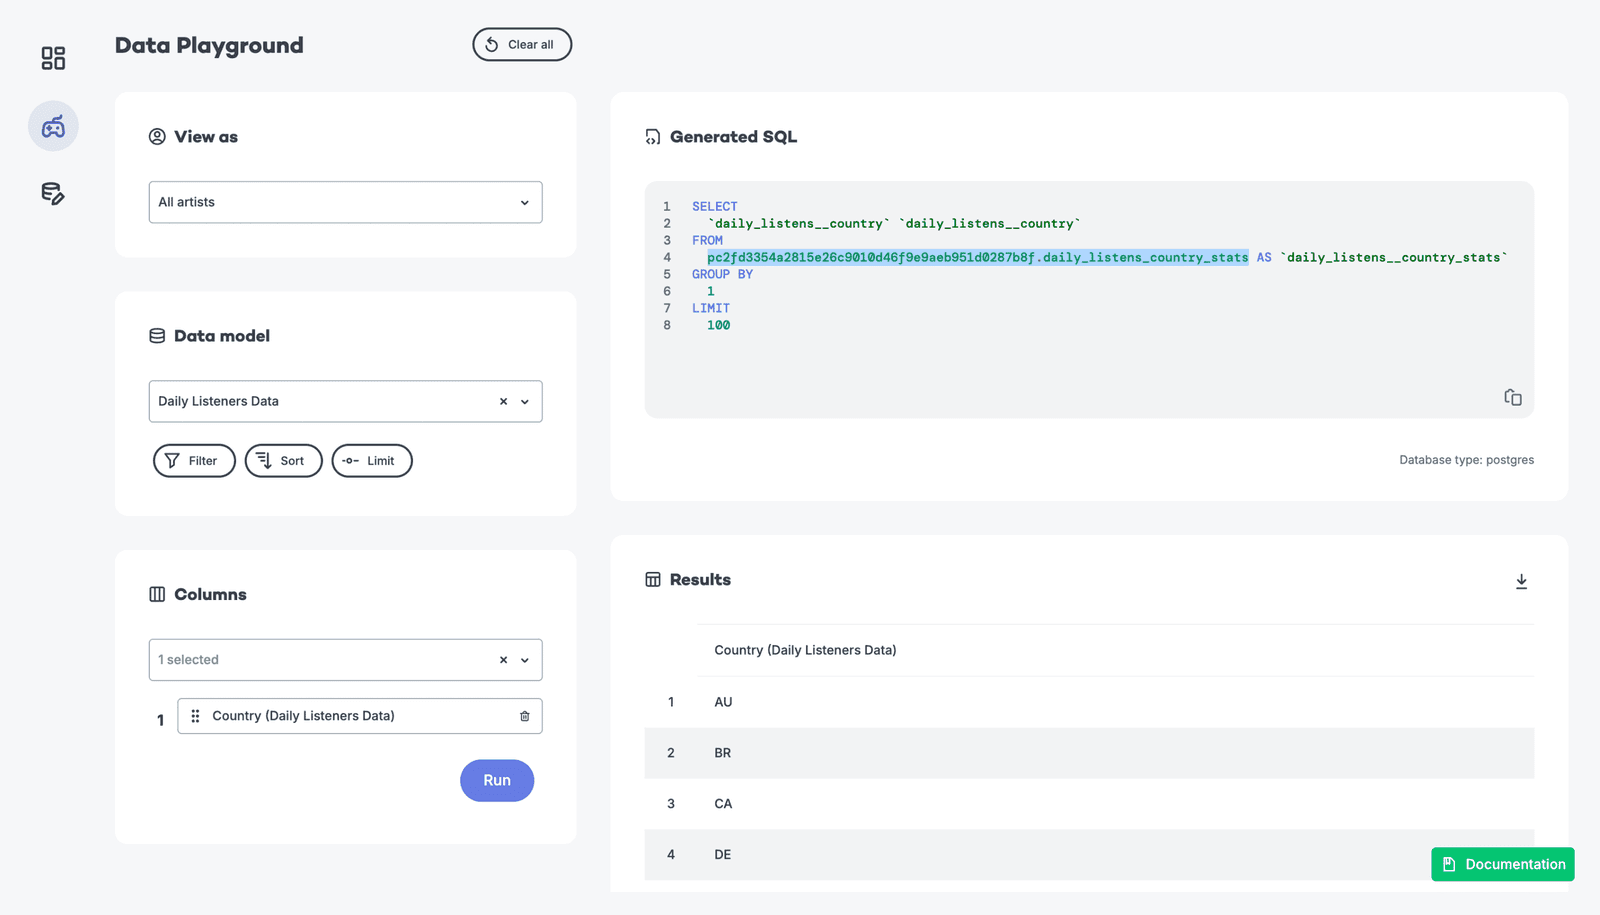
Trade-offs: Pre-aggregation vs. Querying Raw Data
Tests your grasp of data system trade-offs. A great answer weighs pre-aggregation (fast, cheap, stale) against querying raw data (slow, costly, fresh, flexible) and proposes a hybrid solution. A red flag is declaring one method universally superior.
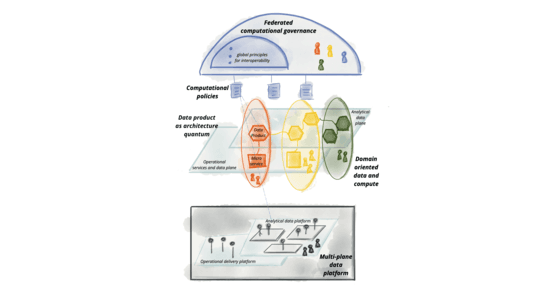
Design a Scalable Data Governance Framework
This tests your grasp of decentralized data architectures like Data Mesh. A great answer proposes a federated model with domain ownership, data as a product, and a self-serve platform.
How do you debug a data quality issue in a complex pipeline?
Tests systematic debugging in distributed systems. A great answer prioritizes containment, traces data lineage from report to source, and proposes specific observability tools.

Design a framework for ensuring data quality and integrity
This tests your ability to design a proactive, multi-layered data quality system, not just reactive fixes. Start with governance (roles/ownership), then detail profiling, validation, and cleansing. Finally, discuss lineage. Red flag: focusing only on one tool.
Diagnosing Out-of-Memory Errors in a Spark Job
This tests your systematic debugging of distributed systems. A great answer first diagnoses the failure location via the Spark UI, then investigates data skew and code inefficiencies, and finally tunes memory configs.

Guarantee at-least-once delivery for a critical analytics event?
Tests reliable messaging patterns to avoid dual-write issues. Propose the Transactional Outbox pattern: atomically write business data and the event to a DB outbox table. A separate relay process then sends the event.

Design a Client-Side Event Batching System
Tests your grasp of client-side performance, network optimization, and data loss edge cases. A great answer batches events in memory, sends them with fetch(), and uses navigator.sendBeacon() on pagehide to reliably send the final batch.

How would you measure the ROI of a data analytics platform?
This tests your ability to connect platform metrics to business value. A good answer defines KPIs for adoption, performance, and cost, then links them to business impact.
Design a KPI Strategy for a Two-Sided Marketplace
Tests your ability to balance a complex ecosystem. A great answer defines KPIs for liquidity (search-to-fill), transaction economics (take rate), and true health (net revenue over GMV).
Design a Column-Level Data Lineage System at Scale
This tests your ability to design for metadata at scale. A great answer outlines automated collection (parsing/instrumentation), storage in a graph database, and APIs for impact analysis.

Investigate a 20% drop in a key revenue metric
This tests your ability to lead a high-pressure investigation. A great answer confirms the drop, traces data from dashboard to source, and differentiates bugs from business trends. A red flag is jumping to conclusions without a systematic, layered approach.
How do you measure impact while accounting for the novelty effect?
Tests your ability to design experiments that isolate long-term effects. A good answer proposes a long-running A/B test, analyzing user cohorts by join date to see if initial lift decays. A red flag is ignoring the novelty effect and suggesting a short test.
Design a Real-Time Analytics Pipeline for Mobile Events
Tests your grasp of low-latency, high-throughput design. A strong answer outlines ingestion (Kafka), stream processing (Flink), and a real-time OLAP database (Druid/ClickHouse). A red flag is proposing a slow, batch-only architecture.
We are hiring for this. Every open role lists the topics its interview covers, so you can prepare for the real thing rather than guessing.
See open roles