Intermediate everything in Analytics & Metrics, page 11

Generate a monthly cohort retention table from user events
This tests your ability to translate a business metric into a multi-step SQL query. A great answer defines cohorts by first activity, maps subsequent activity to period indices, counts distinct users, and pivots the result.

Average latency is up, but p99 is flat. Why?
This tests your grasp of latency distributions. Hypothesize that a large group of typical requests slowed, pulling up the average but not crossing the p99 threshold. Segment by endpoint or customer to find the cohort.

Explain pre-attentive attributes in data visualization
Tests your grasp of visual psychology in data viz. Define pre-attentive attributes (instantly processed visuals), give examples (color, size, shape), and explain using one to highlight outliers in a dense plot.
Feature A correlates with retention. Should we invest more?
Tests your ability to move beyond clichés to propose concrete analysis. A great answer questions the correlation, suggests cohort analysis or A/B testing, and probes for confounding variables. Red flag: just saying 'correlation isn't causation' with no plan.

How would you design a product management dashboard?
Tests your ability to structure data into a decision-making narrative. A good answer moves from a high-level summary (DAU) to trends (retention) and then actionable details (feature adoption). A red flag is simply listing charts without a narrative connection.

How do you ensure accurate counts with duplicate analytics events?
Tests your grasp of data integrity under at-least-once delivery. Explain why COUNT(*) is inflated, then propose deduplication using a unique event ID. Mention trade-offs of stateful processing. A red flag is ignoring the cost or the need for a unique ID.
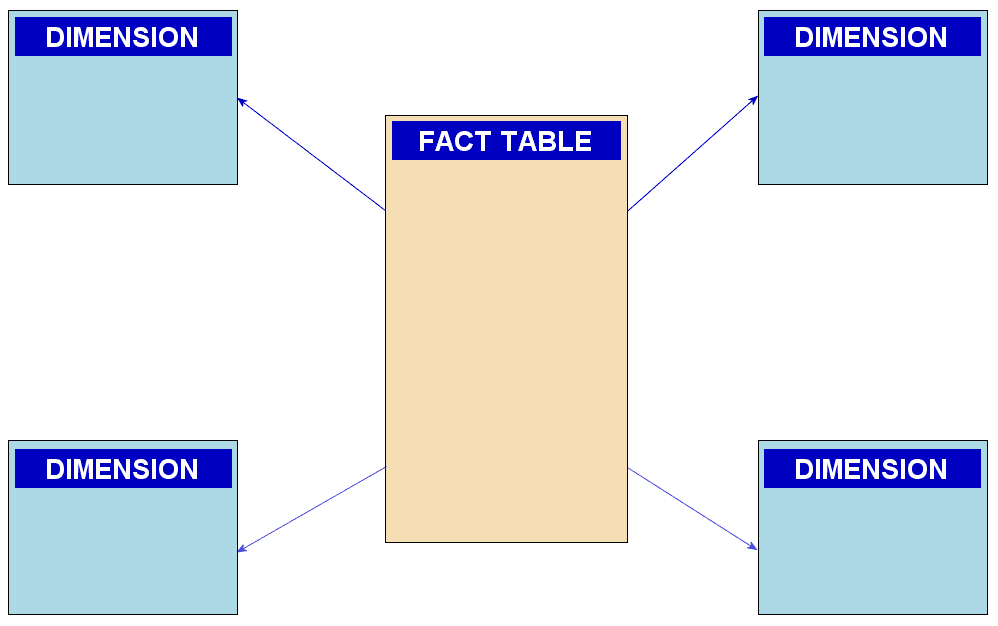
Explain a star schema and its advantages for analytics
Tests your grasp of data modeling trade-offs for OLAP vs. OLTP. A good answer defines fact/dimension tables, then explains how denormalization and fewer joins improve query speed for analytics. A red flag is confusing it with a snowflake schema.
How would you diagnose a slow dashboard query?
This tests your systematic approach to performance tuning. A great answer investigates query optimization, strategic indexing/partitioning, and the data model (like star schema).
How do you create a 'golden record' for customers?
Tests your grasp of data governance and systems thinking. A strong answer defines master data, outlines a phased approach (discovery, rule-setting, implementation), and covers ongoing stewardship.

How to handle schema evolution in a CDC analytics pipeline?
This tests your ability to design resilient CDC pipelines. A strong answer outlines automated schema detection, using a flexible format like Avro, and enforcing governance with a schema registry. A red flag is proposing manual fixes for every change.
Explain data lineage and how you'd implement it
Tests your practical data governance knowledge. Define lineage (origin, transforms, movement), then outline a solution: metadata collection from services, a central store (graph DB), and a visualization tool (Amundsen/OpenLineage).
Compare a data warehouse, data lake, and lakehouse
Tests your grasp of data architectures for BI vs. ML workloads. Contrast warehouses (structured) and lakes (raw), then explain how a lakehouse adds ACID/schema features to a lake's storage. A red flag is confusing schema-on-write vs. schema-on-read.
What is data partitioning in a cloud data warehouse?
Tests your grasp of performance and cost trade-offs in data systems. A good answer defines partitioning, explains partition pruning for performance, and links it directly to reduced data scan costs.
How do you handle late-arriving data in a streaming pipeline?
Tests understanding of event time vs. processing time and the mechanisms (watermarks, triggers, allowed lateness) to ensure correctness. Answer by distinguishing time types, using event-time windowing, defining watermarks, and configuring allowed lateness.
Describe star and snowflake schemas and their trade-offs.
Tests your grasp of data warehouse design trade-offs. Define star (denormalized dimensions) and snowflake (normalized dimensions) schemas. Contrast them: star is faster for queries but uses more space; snowflake is space-efficient but requires more joins.
How do you approach user identity stitching across devices?
This tests your grasp of event-driven data pipelines and identity management. A strong answer outlines an identifier hierarchy, the "stitch" event (login), and a backend process for retroactively applying a canonical user ID.

Build vs. Buy: Third-Party vs. In-House Analytics
Tests your grasp of the time-vs-control trade-off. A great answer weighs speed vs. customization and total cost of ownership. Advocating for 'build' without considering the massive, ongoing maintenance cost is a major red flag.
How would you debug a sudden drop in a key metric?
Tests your systematic debugging of complex data systems. First, validate the drop against a source of truth and segment the data. Then, hypothesize causes like misattribution or data loss.

How do you track page views in a Single Page Application?
This tests your grasp of SPA routing mechanics. A great answer covers both programmatic navigation (using router hooks) and browser history events (popstate), explaining why both are necessary.

Explain the North Star Metric and propose one for a product
Tests your ability to link product strategy to a single metric reflecting customer value and business growth. Define the NSM, propose one for a product like Spotify, and justify it. A red flag is picking a vanity metric like DAU or a pure business metric.
We are hiring for this. Every open role lists the topics its interview covers, so you can prepare for the real thing rather than guessing.
See open roles