Advanced concepts in Data Science & Analytics
Causal Inference: Proving Cause, Not Just Correlation
Causal inference goes beyond correlation to ask "did X *cause* Y?". It's used to prove a new feature drove engagement or a drug improved outcomes. The main footgun is mistaking association for causation, ignoring confounding variables.
Uplift Modeling: Who to Target, Not Just Who Will Convert
Uplift modeling finds who to target by predicting the *change* in behavior from an action, not just the final outcome. It's used in marketing to decide who gets a discount, optimizing spend. The footgun is confusing it with a simple conversion model.
MLE: Find the Parameters That Make Data Likely
MLE tunes your model until observed data looks inevitable. Use it to fit distributions to logs, traffic, or errors. The footgun: it assumes your distribution family is correct; under a wrong model, it finds the best-fitting wrong answer with high confidence.

SVD: Eigendecomposition for Any Matrix
SVD treats any matrix as rotation, then scaling, then rotation. It generalizes eigendecomposition beyond square normal matrices to any real or complex matrix.
The Jacobian Matrix: A Derivative for Multiple Dimensions
The Jacobian matrix is the multi-dimensional version of a derivative. It's a grid of partial derivatives showing how a small change in each input locally affects each output of a vector function. Don't confuse the matrix with its determinant.
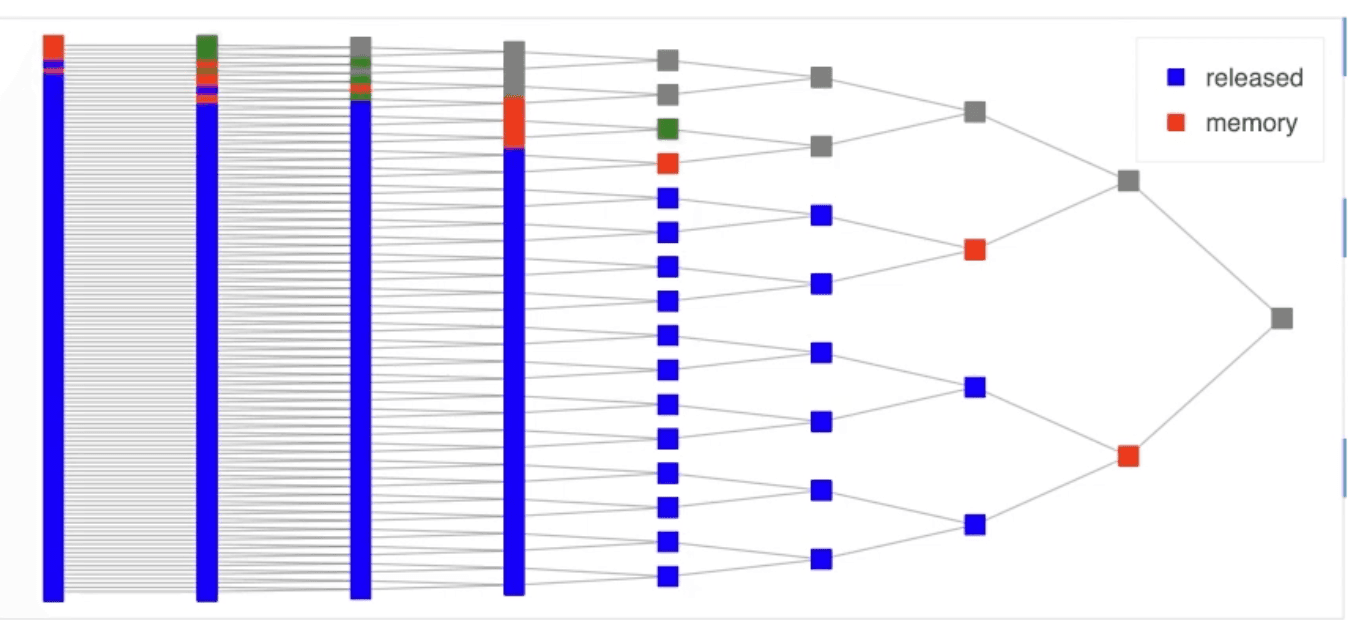
Dask: Parallel Computing with Familiar APIs
Dask parallelizes Python analytics by breaking data into chunks and building a task graph of operations. It's like giving Pandas and NumPy superpowers for data too big for RAM. The footgun: its lazy evaluation means you must explicitly call .compute().

R & Python Interoperability with Reticulate
Reticulate embeds a Python session inside R, letting you use Python libraries as if they were native R objects. Use it when a team uses both languages or you need a Python library in an R workflow.
Scraping Dynamic Sites: Find the API, Not Just Render
To scrape a dynamic site, find the hidden API call its JavaScript makes to fetch data instead of rendering the whole page. This is faster and more reliable. This applies when your scraper gets empty HTML but you see data in your browser.

Streaming Ingestion: Catching Data as It Happens
Streaming ingestion is a conveyor belt for data, catching events as they happen instead of in batches. It's used for real-time fraud detection and IoT monitoring. The footgun is confusing ingestion (getting data in) with processing (acting on it).
gRPC: High-Performance RPC with Contracts
gRPC is a typed, high-performance function call between services. Instead of crafting JSON, you define a contract and gRPC handles the efficient binary transport. It's for low-latency microservice communication.
Log Aggregation and Parsing: From Chaos to Clarity
Log aggregation gathers scattered system events into one place; parsing turns that raw text into structured, searchable data. This is essential for debugging distributed systems or analyzing security incidents.
Feature Engineering: Better Inputs, Better Models
Feature engineering preps raw data for a model, like a chef preps ingredients. It transforms raw inputs into a more effective set of predictive signals. The footgun is creating irrelevant features, which can harm model performance more than using raw data.
Box-Cox Transformation: Forcing Skewed Data to Look Normal
The Box-Cox transformation is a statistical lens that reshapes skewed data to better resemble a normal distribution. It helps meet the assumptions of models like linear regression, but it only works on positive data and complicates direct interpretation of…

Target Encoding: Replacing Categories with Target Stats
Target encoding replaces a category (e.g., "USA") with a statistic from your target variable (e.g., average sales). It's ideal for high-cardinality features where one-hot encoding is impractical. The footgun is data leakage, which causes severe overfitting.
Feature Selection: Making Models Better With Less Data
Feature selection improves models by giving them less data, finding signal by removing noise. Use it to speed up training, simplify models for easier interpretation, and avoid performance degradation from having too many input features.
Facet Grid: A Visual GROUP BY for Your Data
A Facet Grid is a visual GROUP BY. It creates a matrix of plots, each showing a different subset of your data, to compare relationships across categories. The footgun is forgetting to call .map() to draw the plots; the grid is empty on its own.
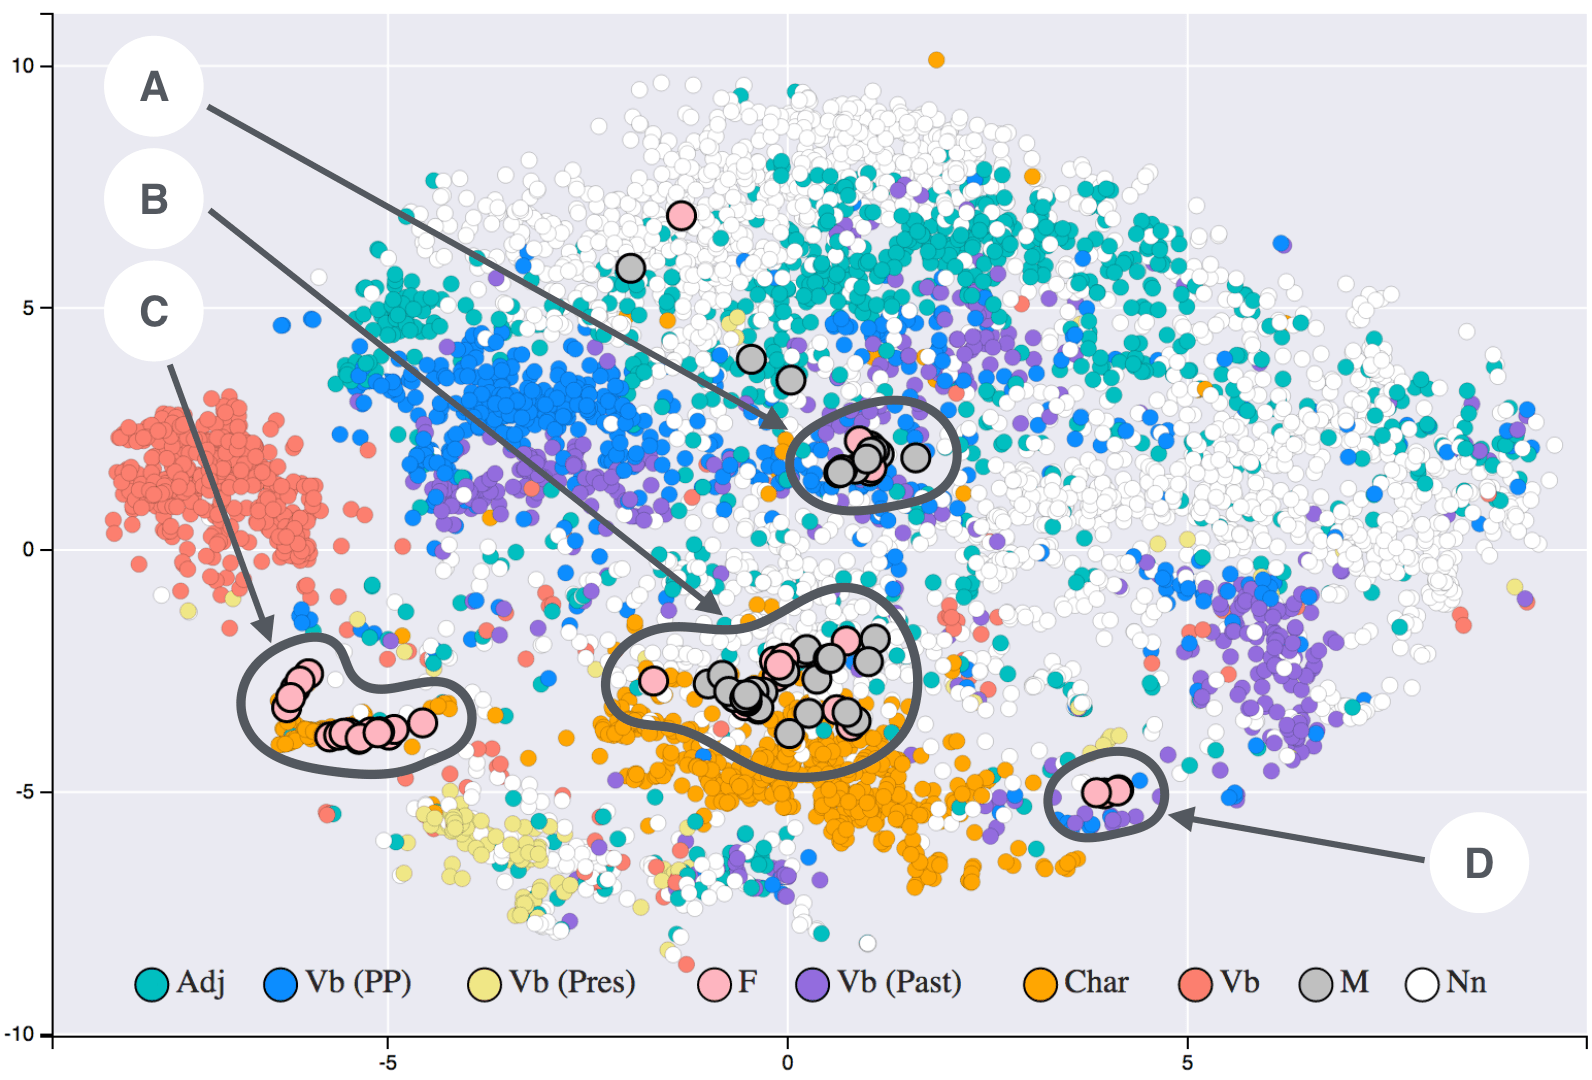
t-SNE: Map High-Dimensional Similarity to 2D
t-SNE turns high-dimensional similarity into 2D or 3D distance: similar points cluster and dissimilar points separate. Use it to visualize complex datasets on a flat map. Do not read exact distances from the plot; it preserves local probability, not geometry.
UMAP: Visualizing High-Dimensional Data's Shape
UMAP projects complex data into a 2D/3D view, preserving local structure like a faithful map of a hilly landscape. Use it to visualize clusters in customer or gene data as a faster t-SNE alternative. Footgun: Cluster sizes and distances are not meaningful.
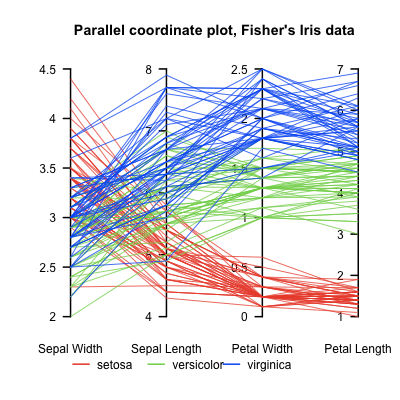
Parallel Coordinates Plot: Untangling High-Dimensional Data
A parallel coordinates plot turns high-dimensional data into a 2D image by laying axes out in parallel. Each data point becomes a line weaving across them. It helps find clusters in multivariate data, but overplotting can make it unreadable with too many…

Regularization: Penalizing Complexity to Prevent Overfitting
Regularization is a complexity tax on a machine learning model, forcing it to favor simpler patterns over memorizing training data. It's used to prevent overfitting in models like neural networks, improving their performance on new, unseen data.
We are hiring for this. Every open role lists the topics its interview covers, so you can prepare for the real thing rather than guessing.
See open roles