Advanced everything in Data Science & Analytics, page 3
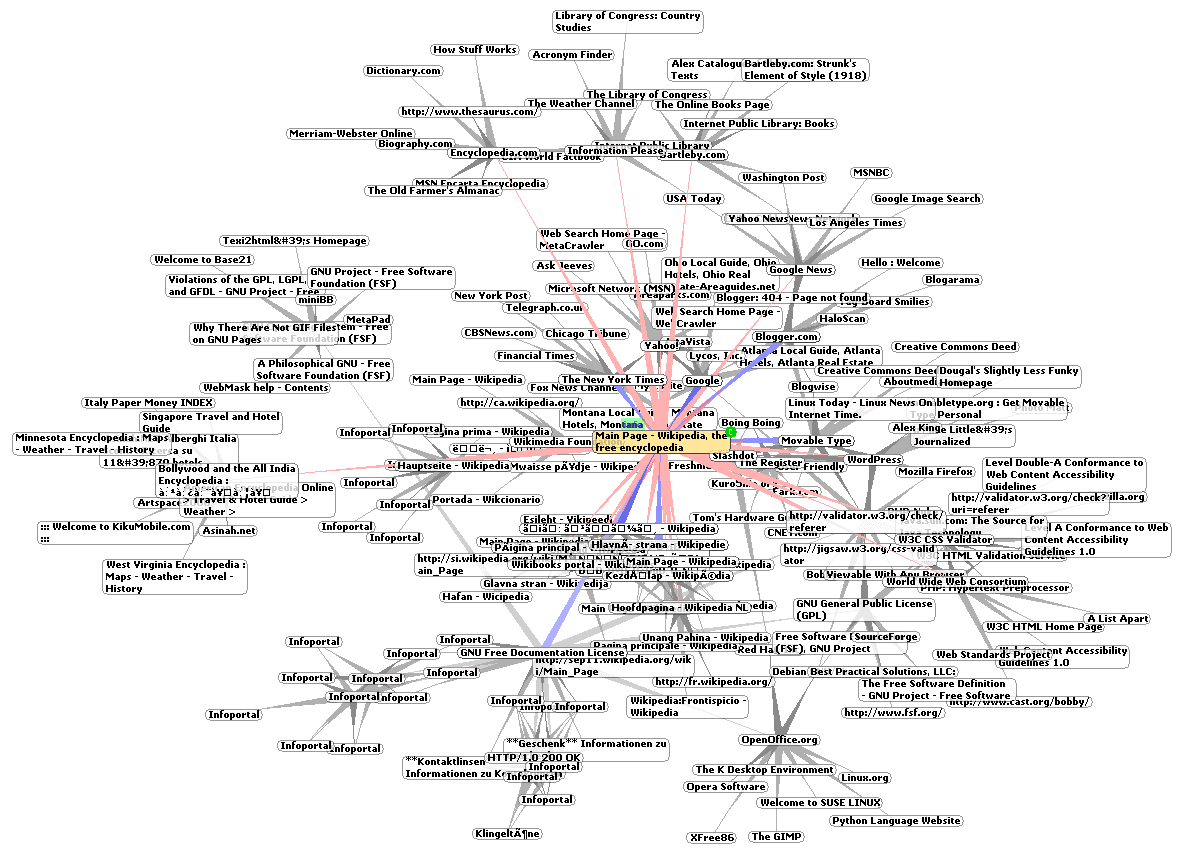
Network Visualization: Making Sense of Connections
Network visualization turns abstract relationships into a 2D map. It's used to see structure in social networks or biological pathways. The footgun is that layout choices can create misleading patterns; a pretty graph isn't always a true one.

Interactive Data Viz: Let Users Explore the Data
Interactive data viz turns a static report into a conversation, giving users controls to ask their own questions. It's key for BI dashboards and research tools. The footgun is overwhelming users with too many options, creating confusion instead of clarity.
Apache ZooKeeper: A Coordinator for Distributed Systems
Think of ZooKeeper as a reliable key-value store for metadata. It provides distributed systems with essentials like configuration management, leader election, and service discovery, ensuring all nodes agree on the system's state.
Policy Gradient: Teach an Agent What to Do, Not What's Valuable
Policy gradient methods directly learn what action to take, rather than learning the value of states. They excel in continuous action spaces like robotics or when the best policy is random.
Large Language Models (LLMs)
An LLM is a massive neural network trained on vast text datasets to perform language tasks. It powers modern chatbots by generating, summarizing, and translating text. The key footgun: biased or inaccurate training data makes its output unreliable.
Causal DAGs: A Map for Cause and Effect
A Causal DAG is a map of your assumptions about what causes what. It helps you spot hidden "confounder" variables that create misleading correlations. Use it before an analysis to decide which variables to control for, ensuring you measure a true effect.
Propensity Score Matching: Simulating a Randomized Trial
Propensity Score Matching creates a 'fair' comparison from observational data, mimicking a randomized trial. It's used to estimate a treatment's effect by matching treated individuals with similar untreated ones.
SUTVA: The Assumption That Your Treatment Isn't Leaking
SUTVA assumes your treatment on one person doesn't spill over to affect others, and that the treatment is consistent for all. It's a key assumption for A/B tests, but is violated when one person's vaccine protects their unvaccinated neighbor.
Ensemble Learning: Bagging vs. Boosting
Ensemble methods combine multiple weak models into one strong one, like a committee outperforming a single expert. Bagging reduces variance; Boosting reduces bias. The footgun: Boosting can overfit noisy data by trying to model the noise itself.
Random Forest: Many Weak Learners Make One Strong Model
A random forest asks a crowd of simple decision trees for a prediction and takes the majority vote. This ensemble approach is used for classification and regression, correcting for a single tree's tendency to overfit. The footgun is its lower interpretability.

Regularization: Penalizing Complexity to Prevent Overfitting
Regularization is a complexity tax on a machine learning model, forcing it to favor simpler patterns over memorizing training data. It's used to prevent overfitting in models like neural networks, improving their performance on new, unseen data.
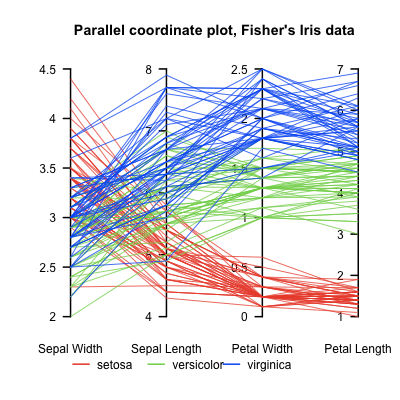
Parallel Coordinates Plot: Untangling High-Dimensional Data
A parallel coordinates plot turns high-dimensional data into a 2D image by laying axes out in parallel. Each data point becomes a line weaving across them. It helps find clusters in multivariate data, but overplotting can make it unreadable with too many…
UMAP: Visualizing High-Dimensional Data's Shape
UMAP projects complex data into a 2D/3D view, preserving local structure like a faithful map of a hilly landscape. Use it to visualize clusters in customer or gene data as a faster t-SNE alternative. Footgun: Cluster sizes and distances are not meaningful.
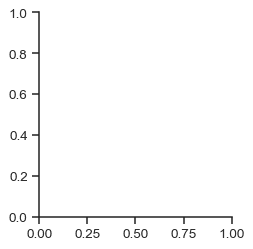
Facet Grid: A Visual GROUP BY for Your Data
A Facet Grid is a visual GROUP BY. It creates a matrix of plots, each showing a different subset of your data, to compare relationships across categories. The footgun is forgetting to call .map() to draw the plots; the grid is empty on its own.
Feature Selection: Making Models Better With Less Data
Feature selection improves models by giving them less data, finding signal by removing noise. Use it to speed up training, simplify models for easier interpretation, and avoid performance degradation from having too many input features.

Target Encoding: Replacing Categories with Target Stats
Target encoding replaces a category (e.g., "USA") with a statistic from your target variable (e.g., average sales). It's ideal for high-cardinality features where one-hot encoding is impractical. The footgun is data leakage, which causes severe overfitting.
Box-Cox Transformation: Forcing Skewed Data to Look Normal
The Box-Cox transformation is a statistical lens that reshapes skewed data to better resemble a normal distribution. It helps meet the assumptions of models like linear regression, but it only works on positive data and complicates direct interpretation of…
Feature Engineering: Better Inputs, Better Models
Feature engineering preps raw data for a model, like a chef preps ingredients. It transforms raw inputs into a more effective set of predictive signals. The footgun is creating irrelevant features, which can harm model performance more than using raw data.
Log Aggregation and Parsing: From Chaos to Clarity
Log aggregation gathers scattered system events into one place; parsing turns that raw text into structured, searchable data. This is essential for debugging distributed systems or analyzing security incidents.
gRPC: High-Performance RPC with Contracts
gRPC is a typed, high-performance function call between services. Instead of crafting JSON, you define a contract and gRPC handles the efficient binary transport. It's for low-latency microservice communication.
We are hiring for this. Every open role lists the topics its interview covers, so you can prepare for the real thing rather than guessing.
See open roles