Everything in Growth & Experimentation, page 3

Explain the difference between statistical and practical significance
Define statistical vs practical significance; note large samples make tiny effects significant; give a real example.
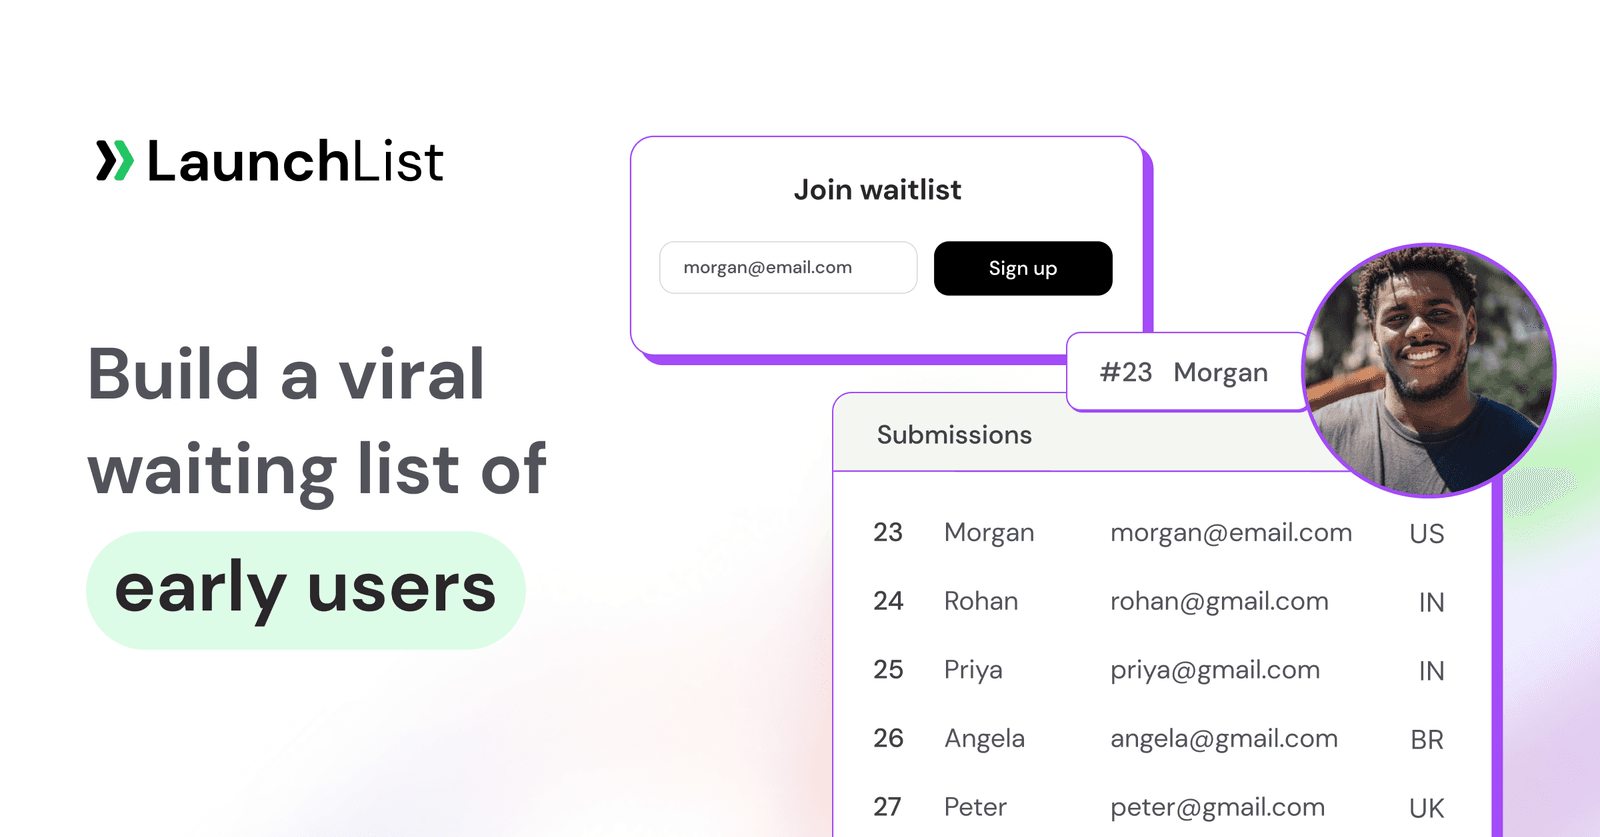
Build a system to measure viral coefficient and attribute invites to signups
Tests if you can map K=i×c to logged events and resilient pipeline. Good answers define invite_sent, click, signup events with referral tokens; sketch stream joins; and flag cross-device and organic attribution gaps. Red flag: assuming perfect attribution.

Design a referral system: data models, APIs, attribution, self-referral prevention
Tests data modeling with fraud guardrails and idempotent rewards. Cover: Users with nullable referred_by, ReferralEvents state table, async ledger attribution, and device-fingerprint self-referral blocks. Red flag: bare integer credit with no audit trail.
Describe cluster or switchback randomization for network-effect A/B tests.
Tests SUTVA violation, cluster-switchback tradeoffs. Outline: cluster (geo, teams) or switchback (time slices) isolation; cover pipeline changes, 10x inflation, and correlated error. Red flag: user-level randomization with post-hoc fixes or ignoring spillover.

Compare server-side and client-side experimentation architectures
This tests rendering-layer architecture. A strong answer contrasts server-side zero-flicker and algorithm tests against client-side marketer agility and SEO safety, mapping each to release cycles. A red flag is claiming one approach dominates every dimension.

How do you prevent concurrent onboarding and navigation experiments from polluting results?
This tests experiment isolation via layer-based traffic allocation. A strong answer covers hashing users into independent layers with one variant per layer, and assigning each experiment to a distinct layer.

How do you systematically manage and pay down experiment debt?
Tests sustainable velocity through experiment lifecycle hygiene. Strong answers cover isolated experiment directories, TTLs on feature flags, and recurring cleanup sprints. Red flag: banning experiments or treating all experiment code as permanent.

What experiment artifacts and metrics do you present to decide shipping?
This tests structured experiment discipline. A strong answer covers the pre-approved design doc, scorecard results for primary goal and guardrail metrics plus secondary breakdowns versus the hypothesis, and duration context.
Lifecycle of a feature flag experiment from creation to cleanup
Tests operational rigor across the full flag lifecycle. A strong answer covers six stages: SDK instrumentation with event tracking, phased rollout, monitored experiment, ship/kill decision, and code cleanup.

How do you mitigate peeking in experiment infrastructure?
Lock results behind minimum samples; auto-correct via sequential testing; hide early metrics and require stop approval.

Design a pre-aggregation architecture for low-latency experiment results
Tests OLAP-at-scale trade-offs. Strong answers design streaming rollups into a real-time OLAP store, use partial cubes for high-cardinality dimensions, and retain raw events.

Design a system to reduce large client-side experiment payload size
Tests edge evaluation and payload compression. Use server-side pre-evaluation or edge nodes sending only assigned variants; compact bucketing indexes or Bloom filters; lazy-load noncritical experiments. Never do full client-side evaluation of every flag rule.
Compare PostgreSQL versus a columnar warehouse for raw event data
Contrast row vs column storage, compression, and scan speed; note Postgres suits OLTP and point lookups while columnar stores excel at aggregations.
Should we build or buy an A/B testing platform?
This tests build-vs-buy judgment for experimentation infrastructure. Strong answers cover build for warehouse metrics and cache control; buy for proven stats and front-end speed. Red flag: answering with cost alone or assuming in-house is always superior.

Design an assignment service for an experimentation platform
This tests deterministic hashing and independence in randomization. A strong answer lists user ID, experiment salt, and allocations; uses salted hash for consistency; and warns that separate exposure and bucket hashes with mod can cause sample ratio mismatch.
How would you implement a simple feature flag system?
Tests runtime config separation and distributed hygiene. Outline: control service, datastore, API, SDK, and update mechanism; local evaluation with cached state; short-lived flags. Red flag: static config files requiring redeployment are not feature flags.
Describe a strategy for reconciling different forecasts into one robust prediction
Tests synthesis of heterogeneous models into a consensus forecast. Strong answers diagnose divergence drivers first, then weight by track record or uncertainty, and output a distribution. Red flag: blind averaging without understanding why models disagree.
How would you adapt a growth model for network effects and k-factor?
Define K as invites x conversion; K over 1.0 explodes, yet K over 0.7 with fast cycle time still compounds; anchor at peak delight.

How would you incorporate external events into a time-series forecast?
This tests exogenous regressor design. A strong answer proposes binary or continuous regressors for holidays and campaigns in Prophet or ARIMA, then validates lift via backtesting. A red flag is dropping outlier days or applying post-hoc manual adjustments.
How would you model a 10% Day-1 retention improvement's impact on LTV?
Tests whether you model retention as a survival curve, not a single point. A strong answer builds a cohort curve, propagates D1 lift to D30/D90 via decay, and sums revenue. Red flag: claiming 10% D1 gain equals 10% LTV growth without curve assumptions.
We are hiring for this. Every open role lists the topics its interview covers, so you can prepare for the real thing rather than guessing.
See open roles