Interview questions in Product Management, page 14

How do you handle duplicate events in an analytics pipeline?
Tests your grasp of data integrity and idempotent processing. Explain how duplicates inflate COUNT(*), then propose adding a unique event_id and using a stateful stream processor to track seen IDs. Mention query-time COUNT(DISTINCT event_id) as an alternative.

How would you break down an epic into user stories?
Tests your ability to turn business goals into independent engineering tasks. A great answer maps user journeys, breaks work into vertical slices, defines acceptance criteria, and prioritizes by value.
How do you ensure accurate counts with duplicate analytics events?
Tests your grasp of data integrity under at-least-once delivery. Explain why COUNT(*) is inflated, then propose deduplication using a unique event ID. Mention trade-offs of stateful processing. A red flag is ignoring the cost or the need for a unique ID.
How do you break down an epic into user stories?
Tests translating business needs into incremental work. A great answer uses story mapping to define a vertical slice MVP, then creates sprint-ready stories with acceptance criteria. A red flag is just listing features without prioritizing user value.
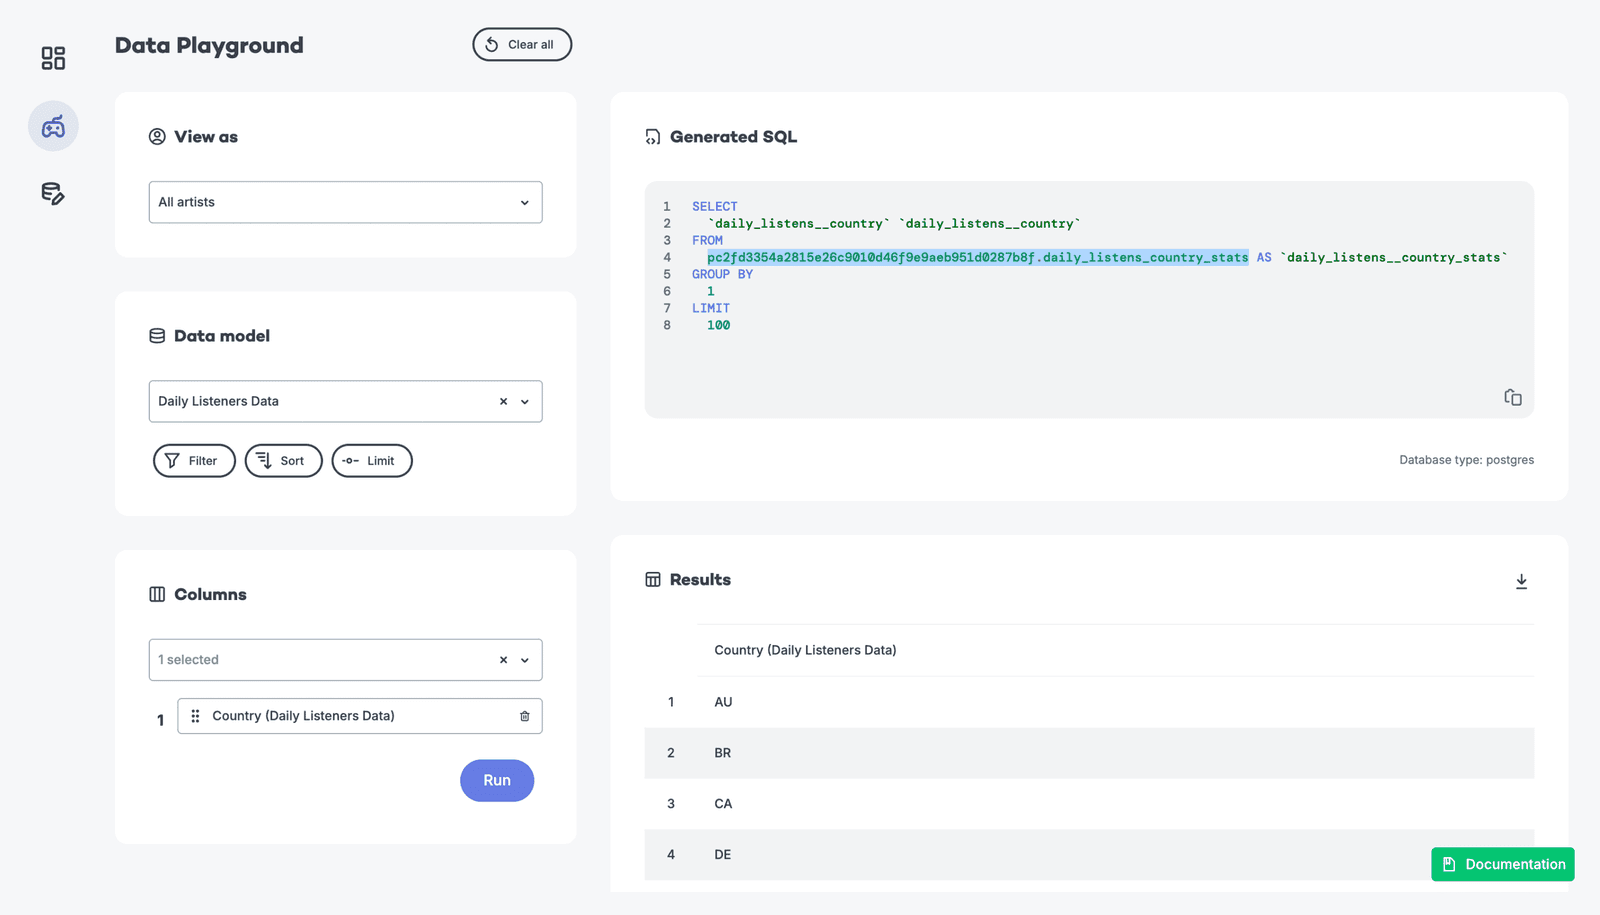
Trade-offs between pre-aggregated and raw event data for dashboards
Pre-aggregations trade freshness for speed; raw queries preserve flexibility but spike cost and latency under load.
How do you translate a non-technical product vision into SLIs and SLOs?
This tests converting qualitative goals into measurable reliability metrics. A good answer identifies user journeys, picks SLIs like latency or yield, sets thresholds from user pain not hardware limits. Red flag: infra metrics like CPU minus user impact.
When increasing CTA clicks, what side-effects and guardrails should you consider?
This tests balancing growth with business safety. Name guardrails like retention, revenue, fraud, load time; set NI thresholds pre-launch; and include SRM checks. A red flag is treating guardrails as optional success metrics instead of hard stop limits.

What root causes and retrospective fixes address chronic sprint overcommitment?
Tests systemic diagnosis over blaming the team. Check capacity math, refinement quality, psychological safety, and stakeholder pressure; propose velocity-guided planning, capacity recalculation, and better refinement.
Trade-offs: Pre-aggregation vs. Querying Raw Data
Tests your grasp of data system trade-offs. A great answer weighs pre-aggregation (fast, cheap, stale) against querying raw data (slow, costly, fresh, flexible) and proposes a hybrid solution. A red flag is declaring one method universally superior.
How do you fix a team that consistently overcommits in sprints?
This tests diagnosing process failures, not just bad estimates. A good answer investigates root causes like external pressure or poor refinement, then proposes using historical velocity and tracking actual capacity.
Trade-offs: Pre-aggregation vs. querying raw event data
This tests your grasp of data engineering trade-offs for analytics dashboards. A great answer contrasts pre-aggregation (fast, cheap, stale) with on-the-fly queries (slow, costly, fresh) and mentions hybrid solutions.
How do you fix a team that consistently overcommits?
This tests diagnosing systemic process failures. A great answer investigates root causes like stakeholder pressure, then proposes using historical velocity, tracking actual capacity, and improving backlog refinement.
Combine qualitative and quantitative data for hypotheses
Quant reveals what and where, qual reveals why, then triangulate into a falsifiable hypothesis with a metric.
What strategy would you propose to fix an unmanageable backlog?
Expose bloat, inspect for value so the PO re-orders and trims waste, then inspect regularly.

How would you prove roadmap divergence from vision and correct course?
Quantify coupling, complexity, and service creep; link compromises to feature delays; propose a funded ATD roadmap with milestones.

What are the challenges of grouping by a high-cardinality dimension?
Tests columnar storage internals and query engine scalability. A strong answer covers memory pressure from giant hash tables, destroyed compression ratios, and massive result-set overhead.
Challenges of Grouping by High-Cardinality Dimensions
This tests your grasp of system-level impacts of data shape. A good answer explains how high cardinality strains memory during aggregation, reduces compression, and inflates index size, leading to slow, expensive queries. A red flag is just saying 'it's slow'.
How would you fix a long, unmanageable product backlog?
Tests your ability to fix a core process failure, not just list grooming tactics. Propose a dedicated workshop to define a clear Product Goal, ruthlessly prune the backlog against it, and establish a sustainable refinement process. Red flag: blaming the PO.
Challenges of Grouping by a High-Cardinality Dimension
This tests your grasp of how data shape impacts system resources. A great answer explains that high cardinality explodes memory usage for aggregation state, increases CPU load, and hurts storage compression.
How do you fix a 200-item unmanageable product backlog?
Tests strategic thinking and Agile leadership. A strong answer proposes a collaborative workshop, re-anchors on the Product Goal, ruthlessly triages items, and establishes a new refinement process.
We are hiring for this. Every open role lists the topics its interview covers, so you can prepare for the real thing rather than guessing.
See open roles