Intermediate everything in Product Management, page 41

Vanity vs. Actionable Metrics: Measure What Matters
Actionable metrics are levers that change business outcomes; vanity metrics are scoreboard numbers that feel good but don't inform decisions. Use this distinction when setting KPIs to avoid the footgun of celebrating 'total downloads' over actual retained…

Experimentation Culture: Data Over Opinions
An experimentation culture prioritizes data over intuition, treating business ideas as testable hypotheses. It's crucial in product development for A/B testing features and UI. The footgun is only testing minor tweaks instead of challenging core assumptions.

Data Visualization: Telling a Story with Data
Data visualization turns raw numbers into graphics that reveal hidden patterns. It’s about designing visuals to help people quickly explore and interpret complex information, like using infographics to convey a concise message to the public.
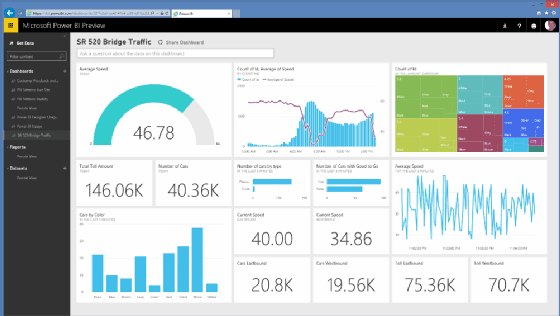
Self-Service Analytics: Let Teams Answer Their Own Data Questions
Self-service analytics gives business teams tools like Power BI to explore data and build reports without waiting for an analyst. This speeds up decision-making by giving teams direct data access.

Data Democratization: Self-Service Analytics for Everyone
Data democratization means non-technical staff can access and use data without waiting for IT. It empowers sales to analyze their pipeline or marketing to track campaign ROI directly.
Analyzing Feature Engagement: Breadth vs. Depth
Breadth vs. Depth analysis plots features on a 2x2 grid: how many people use a feature (breadth) vs. how often (depth). It helps decide where to invest, like improving a popular but seldom-used feature or boosting a niche power-user tool.

Conversion Rate Optimization (CRO): Get More Value from Existing Traffic
CRO is the science of getting more value from your existing users, not just acquiring new ones. It’s used to increase purchases on e-commerce sites or drive signups for a service.
Behavior-Driven Development (BDD): Requirements as Tests
BDD turns requirements into executable tests using a shared, human-readable language. Use it for complex features where business and tech teams need to align. The footgun is writing BDD scenarios *after* coding, missing the collaborative design benefit.

Product-Qualified Lead (PQL)
A product qualified lead is a user whose in product behavior, not a form fill or sales call, signals they are ready to buy. Product led companies use signals like inviting teammates or hitting a usage cap to route high intent users to sales.

The Power User Curve: Go Beyond DAU/MAU
The Power User Curve is a histogram showing user activity distribution, revealing what single metrics like DAU/MAU hide. It shows if you have a core of daily "power users" (a "smile" curve) or just casual visitors, guiding your product and monetization…

The Aha! Moment: Finding Your Product's Core Value
The Aha! Moment is when a user first understands your product's core value, turning them from a trial user into a long-term customer. It's key for product teams improving activation and reducing churn.
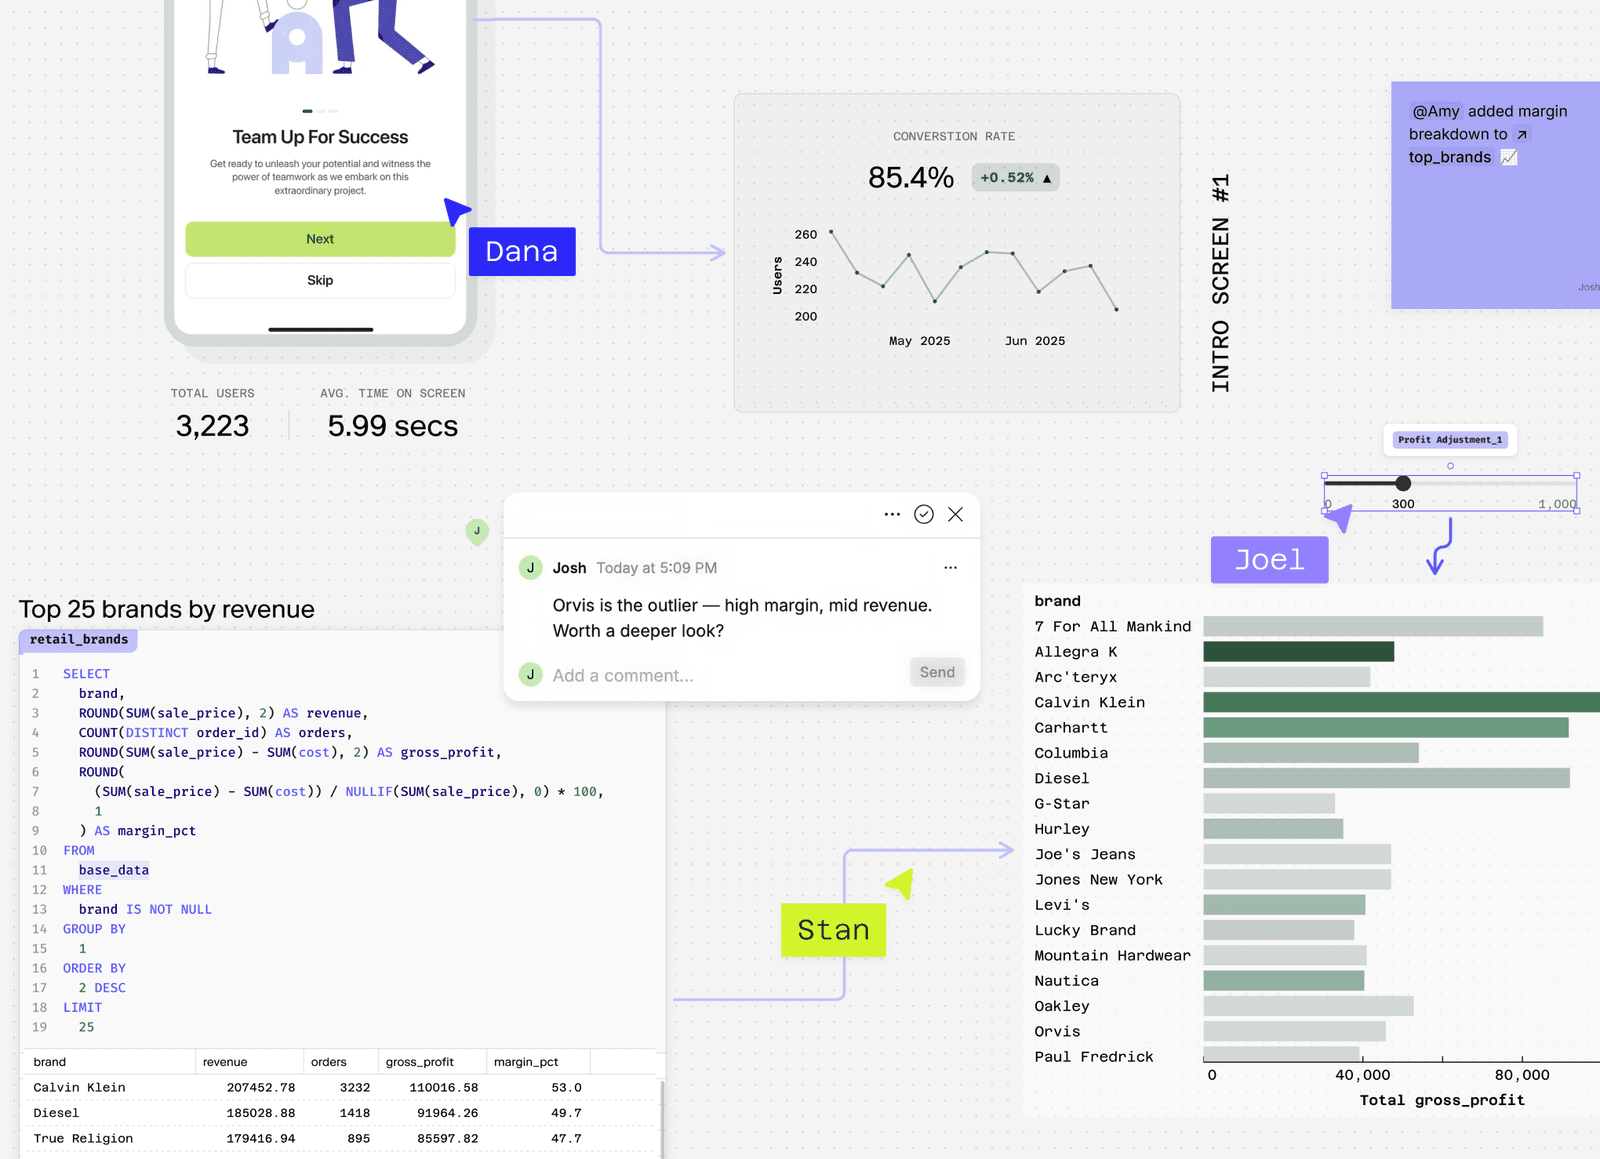
User Engagement Score: A Health Check for Your Product
A User Engagement Score distills complex user behavior into a single number, showing if users find value or are at risk of churning. Product teams use it to gauge feature adoption, while success teams identify at-risk accounts.
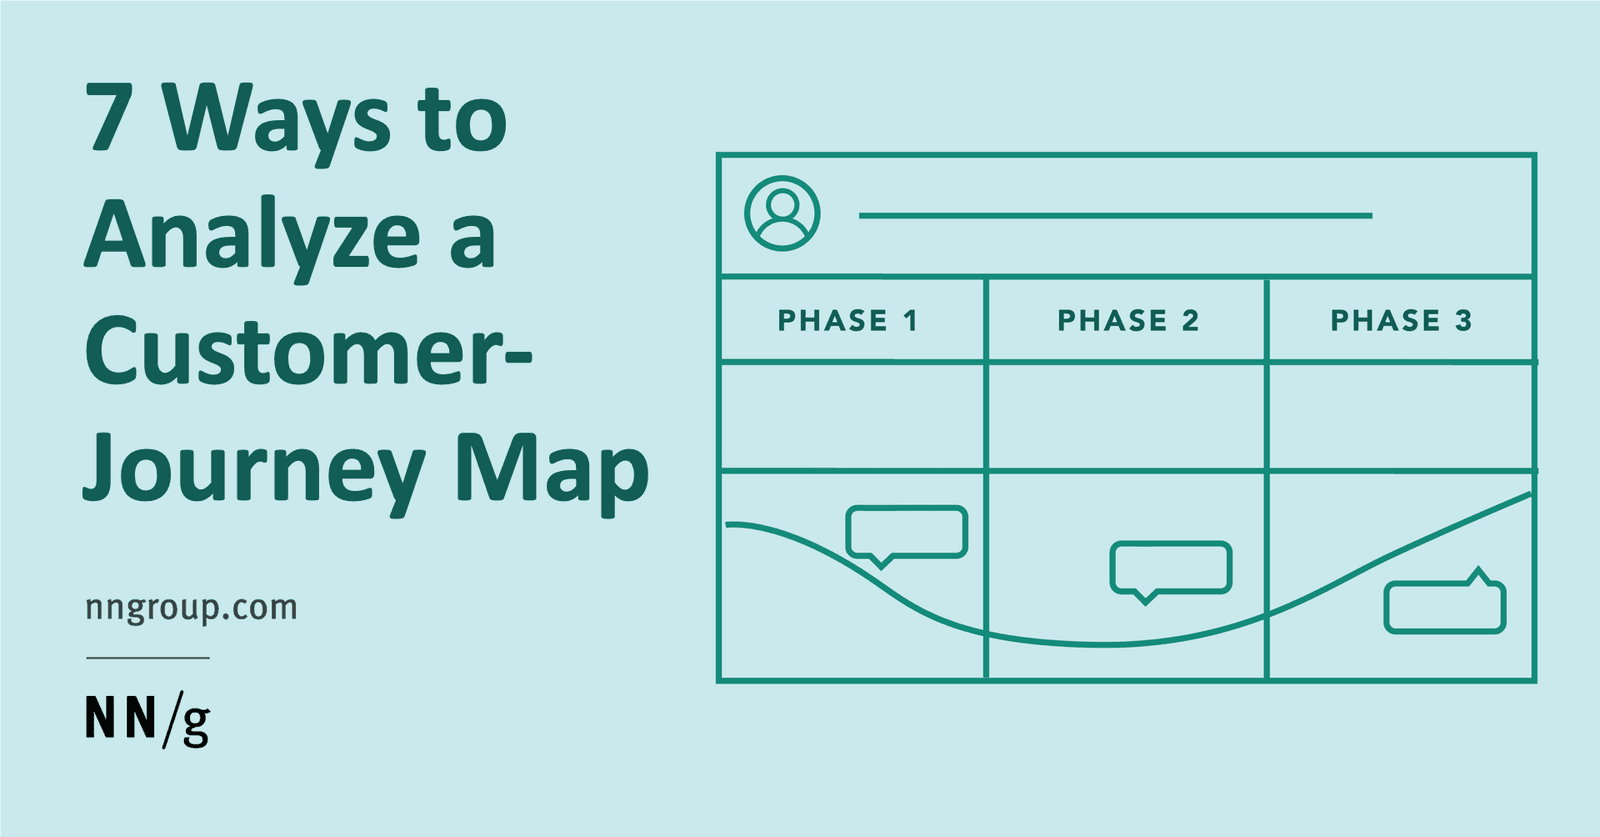
User Journey Analysis: Finding Friction and Opportunity
User journey analysis is like watching a film of your customer's experience to find plot holes. It helps spot where a product fails to meet expectations or has redundant steps. The biggest footgun is analyzing without a clear persona in mind.
Segment: The Universal Translator for Customer Data
Segment is a universal translator for customer data. Track an event once in your app, and Segment forwards it to all your marketing and analytics tools, saving you from building dozens of separate integrations.
Looker: Google's Data Analytics Platform
Looker is Google Cloud's data analytics platform that creates a single source of truth for metrics. It uses a modeling language, LookML, to define business logic on top of your database.
dbt: Managing Data Transformations as Code
dbt treats your data transformations as a software project, letting you build, test, and version control your SQL. It's the 'T' in the modern ELT paradigm. Use it to create reliable data models in a warehouse. The footgun: dbt only transforms data.
Amplitude: Analytics for Understanding User Behavior
Think of Amplitude as a DVR for user actions, not just a traffic counter. It tracks what users *do* inside your app, letting you build funnels and segment users by behavior.

Sales Velocity: How Fast Your Pipeline Makes Money
Think of sales velocity as the speedometer for your revenue engine, measuring how quickly your pipeline generates money. Sales leaders use it to forecast revenue and find bottlenecks.
Burn Rate: Your Startup's Financial Clock
Burn rate is your company's financial countdown timer, showing how fast you're spending cash before you run out. Startups use it to track monthly cash consumption and determine their runway.
Customer Lifetime Value (CLV): A Customer's Total Worth
Customer Lifetime Value (CLV) predicts the total net profit a customer will generate, not just a single sale's revenue. It's used to set acquisition budgets and guide retention efforts. The footgun is using revenue instead of profit, leading to overspending.
We are hiring for this. Every open role lists the topics its interview covers, so you can prepare for the real thing rather than guessing.
See open roles