All bites
The whole library, newest first. Filter by what you are here for, or pick a topic if you already know.
4247 bites
Page 123
P-value: Probability of Your Data, Not Your Hypothesis
A p-value measures how surprising your data is, assuming your null hypothesis (e.g., "no change") is true. It's used in A/B tests to decide if an effect is real. The footgun: a low p-value doesn't prove your theory, it just casts doubt on the null.

Confidence Interval: Quantifying Uncertainty in Your Estimates
A confidence interval puts error bars around a measurement, showing the plausible range for a true value. It's used in A/B tests to report not just a winner, but the range of its likely impact.
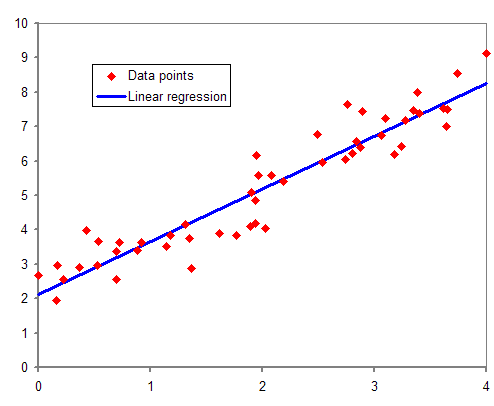
Regression Analysis: Finding the Line of Best Fit
Regression analysis draws a line through data to model relationships between variables. Use it to predict a house price from its square footage or forecast sales from ad spend. The footgun: a strong correlation doesn't prove one variable causes the other.
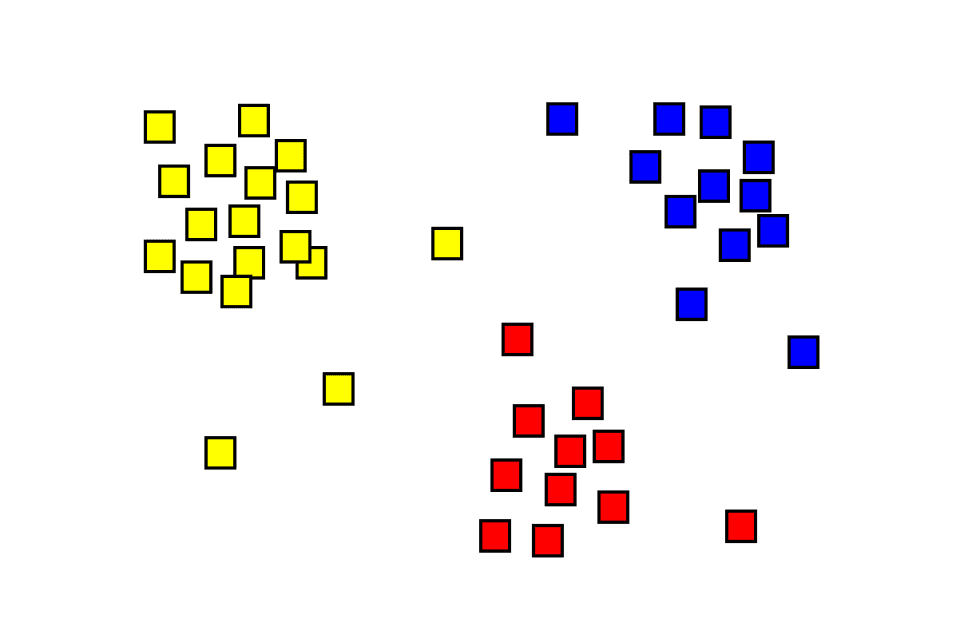
Cluster Analysis: Finding Hidden Groups in Your Data
Cluster analysis automatically finds natural groupings in unlabeled data, like sorting a mixed bag of Legos without a manual. It's used for customer segmentation or anomaly detection.
Outlier Detection: Finding Data That Doesn't Belong
Outlier detection finds data points that don't fit the pattern, signaling an error, fraud, or a new event. It's used to spot faulty sensor readings or fraudulent transactions.

Simpson's Paradox: When Averages Mislead
Simpson's Paradox is when a trend seen in separate groups reverses when you combine them. This happens when a hidden variable, like user experience level, skews the results, making a bad feature look good overall. Always segment your data to avoid this trap.

Principal Component Analysis (PCA)
PCA finds the most informative axes in your data, letting you compress many features into a few "principal components." Use it to visualize high-dimensional datasets or preprocess features for machine learning, but beware: the components are hard to interpret.
Time Series Decomposition: Separating Signal from Noise
Time series decomposition breaks a metric into its core parts: long-term trend, repeating seasonal patterns, and random noise. This helps you understand *why* a metric changed—was it a real shift or just the usual holiday rush?

Probability Distribution: Mapping What's Possible
A probability distribution maps every possible outcome of a random event to its likelihood. It's used in A/B testing to model conversions or in monitoring to predict server load. The footgun is assuming every distribution is a bell curve; many are not.
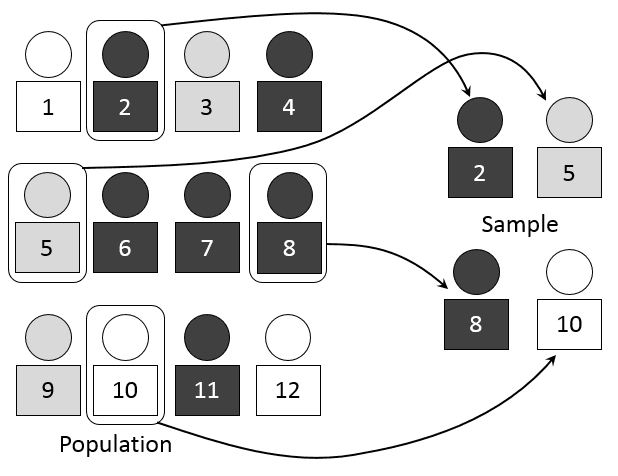
Sampling: Estimating the Whole from a Small Part
Sampling lets you understand a large group by studying a small, representative piece. Think of it like tasting a spoonful of soup to season the whole pot. It's used in A/B tests and polls, but the main footgun is a biased sample.

Law of Large Numbers: More Data, Truer Average
The more you repeat an experiment, the closer your average result gets to the true, underlying average. This is why A/B tests need sufficient traffic and casinos can reliably predict earnings. The footgun is mistaking it for the 'law of averages' fallacy.
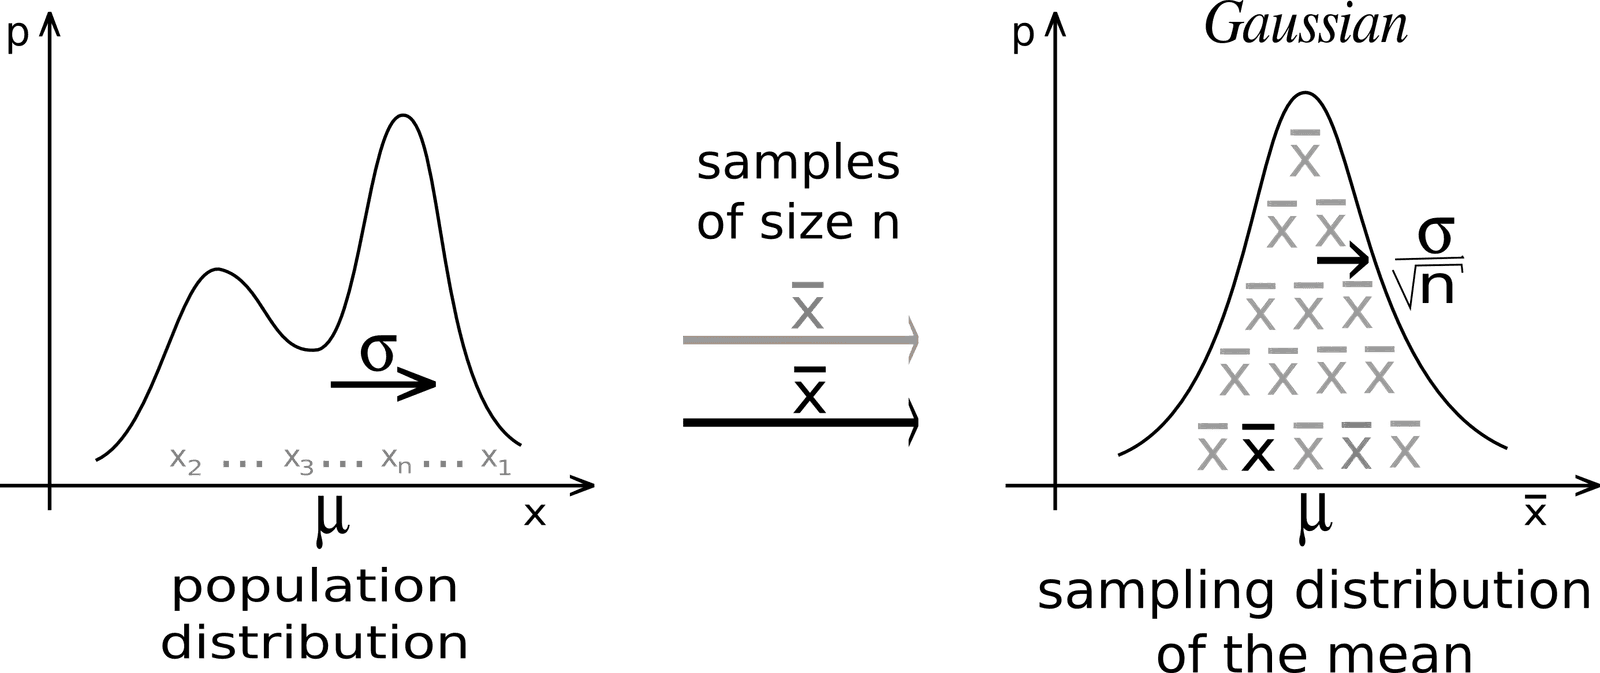
Central Limit Theorem: Why Averages Form a Bell Curve
The Central Limit Theorem explains why averages of samples tend to form a bell curve, even if the original data doesn't. It's the foundation for A/B testing and quality control. The footgun is assuming it works for small or non-independent samples.
Hypothesis Testing: Is Your Data Signal or Noise?
Hypothesis testing is a courtroom trial for your data: you assume a default 'null hypothesis' is true until your data provides enough evidence to reject it. It's used in A/B tests to validate changes.

A/B Testing: Making Decisions with Data, Not Guesses
A/B testing is a controlled experiment pitting two versions of a product against each other with real users. It's used to see if a change, like a new button color, improves a metric like clicks.
Type I vs. Type II Errors: False Alarms vs. Missed Detections
A Type I error is a false alarm (a smoke alarm with no fire), while a Type II error is a missed detection (a fire with no alarm). This trade-off is crucial in A/B testing and medical diagnostics.

Standard Error: Gauging Your Measurement's Precision
Standard error measures the precision of a sample statistic, like the mean. It answers: "If I ran this experiment again, how much would my result change?" It's key for building confidence intervals and A/B testing. Don't confuse it with standard deviation.
Bayesian Inference: Updating Beliefs with Data
Bayesian inference formalizes learning from experience, updating your belief in a hypothesis as you gather evidence. It's used in A/B testing and medical diagnostics. The footgun is that a poor initial belief (the prior) can skew your conclusions.
ANOVA: Comparing Group Averages by Analyzing Spread
ANOVA checks if group averages are different by comparing the spread *between* groups to the spread *within* them. It's used to see if three ad campaigns yield different click-through rates.
Statistical Power: Detecting Real Effects in Your Tests
Think of statistical power as your experiment's sensitivity. It's the probability of detecting a real effect, like a true lift in an A/B test. The main footgun is running a low-power test, which will likely miss a real improvement and lead you to discard good.
Bootstrapping: Quantifying Uncertainty with Resampling
Bootstrapping estimates uncertainty by resampling your own data. It's used to find confidence intervals for complex stats like medians where no simple formula exists. The footgun: it can't fix a biased sample, only reveal the uncertainty within it.