All bites
The whole library, newest first. Filter by what you are here for, or pick a topic if you already know.
4330 bites
Page 123

A key metric dropped 20%. How would you investigate?
This tests systematic diagnosis of critical issues. A great answer segments the drop (by region, platform), then traces data upstream from the dashboard to the source, correlating with technical metrics. A red flag is jumping to code before scoping the impact.
Investigate a 20% drop in a key revenue metric
This tests your ability to lead a high-pressure investigation. A great answer confirms the drop, traces data from dashboard to source, and differentiates bugs from business trends. A red flag is jumping to conclusions without a systematic, layered approach.
Design column-level data lineage from source to dashboard
Propose AST extractors for Spark and dbt, a graph DB for column edges, and an API for impact analysis.
Design a Column-Level Data Lineage System at Scale
Tests your ability to design a metadata system with three distinct components. A strong answer outlines collection (e.g., OpenLineage), storage in a graph database (e.g., Neo4j), and visualization for impact analysis.
Design a Column-Level Data Lineage System at Scale
This tests your ability to design for metadata at scale. A great answer outlines automated collection (parsing/instrumentation), storage in a graph database, and APIs for impact analysis.

What is the difference between a metric and a KPI?
Tests strategic vs operational measurement discernment. Answer: KPIs track critical goals; metrics track processes. Page views are a metric; conversion rate is the KPI. Red flag: calling all data KPIs or using page views as success proof.
What is the difference between a metric and a KPI?
This tests your ability to connect technical measures to business outcomes. Define metrics as operational data and KPIs as the subset tied to critical goals.
What's the difference between a metric and a KPI?
This tests your ability to connect technical measurements to strategic business outcomes. A great answer defines both, notes KPIs are a subset of metrics tied to goals, and gives a concrete example like page views (metric) vs. conversion rate (KPI).

Apply AARRR to B2B SaaS vs B2C mobile game analytics
This tests mapping AARRR to instrumentation across business models. A strong answer contrasts B2B account activation and expansion against B2C session-zero funnels and whale monetization. Red flag: same metrics ignoring account hierarchies and ad attribution.
Apply the AARRR framework to B2B SaaS vs. B2C mobile games
Tests translating the AARRR framework into concrete analytics for different business models. Define AARRR, then contrast B2B SaaS (account-level activation) with B2C games (user-level engagement). Red flag: using identical metric definitions for both contexts.
Describe AARRR and apply it to B2B vs. B2C analytics
Tests applying the AARRR framework to different business models. Define AARRR, then apply to B2B SaaS (account-level activation) vs. a B2C game (user-level virality). Red flag: using generic metrics that ignore the context of B2B sales vs. B2C usage.
Designing a useful button_click event payload
Include identity, timestamp, and context plus properties like button id, screen, and state; govern with a naming convention.
How would you design a 'button_click' analytics event payload?
This tests your ability to design for future analysis. A great answer specifies core identifiers (user ID, timestamp), contextual properties (page, component), and a flat JSON structure. A red flag is forgetting the user ID or providing an unstructured list.
Design an analytics event payload for a button click
This tests your data modeling for analytics. A good answer includes the event name, user ID, and timestamp, then adds contextual and user properties. A red flag is forgetting the user ID or suggesting dynamic property names, which breaks segmentation.
Enforcing GDPR Right to be Forgotten at scale
Map the subject's data, then crypto-shred the lake, DELETE in the warehouse, and evict caches via an auditable, idempotent workflow.
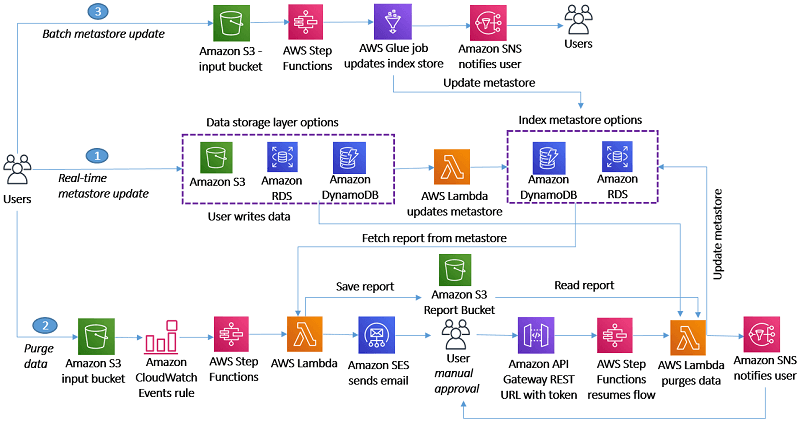
Enforce GDPR's Right to be Forgotten Across a Complex Architecture
This tests your design of a verifiable, async deletion workflow. A strong answer proposes a central index metastore, an orchestrated workflow (e.g., Step Functions) for deletion, and an auditing layer.
Design a GDPR 'Right to be Forgotten' System
Tests your ability to design a verifiable data deletion system. A good answer outlines an index metastore, an orchestrated workflow, and auditing. A red flag is focusing only on the primary database, ignoring the data lake, warehouse, and caches.
Visualizing a non-linear funnel with re-entry
A linear funnel cannot show branching or re-entry; a Sankey diagram encodes flow volume, splits, and leaks as proportional ribbons.

How to visualize a complex, multi-stage customer funnel?
Tests your ability to choose the right visualization for non-linear user flows. Propose a Sankey or Alluvial diagram to show flow volume, drop-off, and re-entry. A red flag is suggesting multiple simple charts that fail to show the paths between stages.
How would you visualize a complex, multi-stage user funnel?
Tests product sense and data viz literacy. A good answer proposes a Sankey/Alluvial diagram to show non-linear flows, explains how it visualizes drop-off and re-entry, and notes the data needs. A red flag is just suggesting a better standard funnel chart.