All bites
The whole library, newest first. Filter by what you are here for, or pick a topic if you already know.
8667 bites
Page 416

AARRR Framework: Pirate Metrics for Growth
The AARRR framework models your business as a five-stage customer funnel: Acquisition, Activation, Retention, Referral, Revenue. It's used to pinpoint leaks in your growth engine. The footgun is tracking raw counts instead of conversion rates between stages.

The North Star Metric: A Single Focus for Product Strategy
A North Star Metric is the one number that best captures the core value your product delivers to customers. It aligns entire teams on a single goal, simplifying prioritization and reducing wasted work. The footgun is mistaking revenue for a North Star.

Vanity vs. Actionable Metrics: Measure What Matters
Actionable metrics are levers that change business outcomes; vanity metrics are scoreboard numbers that feel good but don't inform decisions. Use this distinction when setting KPIs to avoid the footgun of celebrating 'total downloads' over actual retained…
Data Ethics: Beyond 'Can We?' to 'Should We?'
Data ethics is the moral framework for handling data, especially personal data. It applies when building systems that collect user info or make automated decisions.
The Chief Data Officer: Turning Data into a Business Asset
The CDO is an executive who treats company data like a financial asset, not just a technical resource. They drive strategy in data-heavy firms, overseeing governance and analysis to create value.

Experimentation Culture: Data Over Opinions
An experimentation culture prioritizes data over intuition, treating business ideas as testable hypotheses. It's crucial in product development for A/B testing features and UI. The footgun is only testing minor tweaks instead of challenging core assumptions.

Data Visualization: Telling a Story with Data
Data visualization turns raw numbers into graphics that reveal hidden patterns. It’s about designing visuals to help people quickly explore and interpret complex information, like using infographics to convey a concise message to the public.
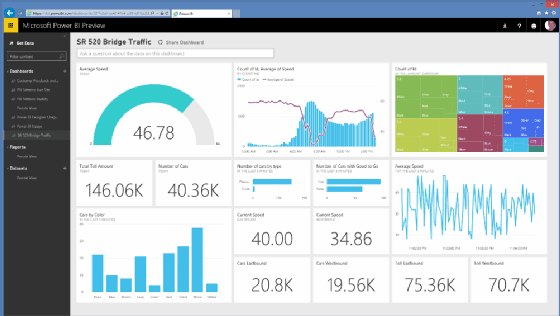
Self-Service Analytics: Let Teams Answer Their Own Data Questions
Self-service analytics gives business teams tools like Power BI to explore data and build reports without waiting for an analyst. This speeds up decision-making by giving teams direct data access.

Data Democratization: Self-Service Analytics for Everyone
Data democratization means non-technical staff can access and use data without waiting for IT. It empowers sales to analyze their pipeline or marketing to track campaign ROI directly.
Single Source of Truth (SSOT): One Place for Every Fact
A Single Source of Truth (SSOT) means every piece of data has one authoritative home. Instead of emailing report_v3.docx, you share one link. This prevents conflicts between billing and shipping data.
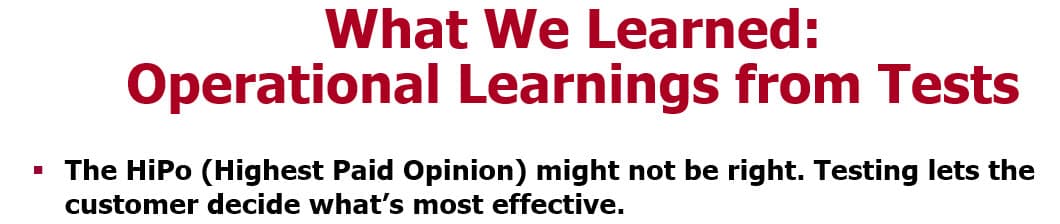
HiPPO: Highest Paid Person's Opinion
HiPPO stands for "Highest Paid Person's Opinion," where a senior leader's gut feeling overrules data. This occurs when deciding on features without A/B tests. The footgun: a HiPPO's intuition can kill great ideas or greenlight costly failures.
Data Literacy: Reading the Story in the Numbers
Data literacy is reading comprehension for numbers. It's the ability to turn raw data into a coherent story, a crucial skill for anyone using dashboards or A/B test results. The biggest footgun is confusing correlation with causation.

User Journey Orchestration: From Map to Reality
User Journey Orchestration is the conductor for your customer's experience, ensuring every team and channel plays in harmony. It translates a static journey map into a live, consistent experience by coordinating actions across touchpoints.
Customer Resurrection Rate: Winning Back Lost Customers
Customer Resurrection Rate measures how many "lost" customers you win back. It's crucial for subscription or e-commerce businesses running re-engagement campaigns. The footgun is a vague definition of "churned"—without a clear line, the metric is meaningless.
Analyzing Feature Engagement: Breadth vs. Depth
Breadth vs. Depth analysis plots features on a 2x2 grid: how many people use a feature (breadth) vs. how often (depth). It helps decide where to invest, like improving a popular but seldom-used feature or boosting a niche power-user tool.

Conversion Rate Optimization (CRO): Get More Value from Existing Traffic
CRO is the science of getting more value from your existing users, not just acquiring new ones. It’s used to increase purchases on e-commerce sites or drive signups for a service.

Training vs. Test Sets: Judging a Forecast's True Accuracy
Don't judge a forecast by how well it fits the data it was trained on. To measure true accuracy, split your data into a training set for model fitting and a test set for evaluation, using data the model has never seen before.
Tag Management Systems: Control Your Analytics Snippets
A Tag Management System (TMS) is a single container for all the analytics and marketing scripts you'd otherwise hardcode. Instead of asking engineers to add new scripts, you add them via a web UI.
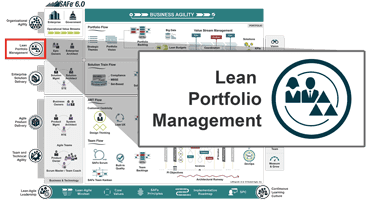
Lean Portfolio Management (LPM): Connecting Strategy to Execution
LPM connects strategy to execution by applying Lean thinking to funding and governance. It manages a portfolio of development value streams—like an e-commerce site—to ensure work aligns with business goals.
Behavior-Driven Development (BDD): Requirements as Tests
BDD turns requirements into executable tests using a shared, human-readable language. Use it for complex features where business and tech teams need to align. The footgun is writing BDD scenarios *after* coding, missing the collaborative design benefit.