All bites
The whole library, newest first. Filter by what you are here for, or pick a topic if you already know.
8667 bites
Page 417

Product-Qualified Lead (PQL)
A product qualified lead is a user whose in product behavior, not a form fill or sales call, signals they are ready to buy. Product led companies use signals like inviting teammates or hitting a usage cap to route high intent users to sales.

The Power User Curve: Go Beyond DAU/MAU
The Power User Curve is a histogram showing user activity distribution, revealing what single metrics like DAU/MAU hide. It shows if you have a core of daily "power users" (a "smile" curve) or just casual visitors, guiding your product and monetization…

The Aha! Moment: Finding Your Product's Core Value
The Aha! Moment is when a user first understands your product's core value, turning them from a trial user into a long-term customer. It's key for product teams improving activation and reducing churn.
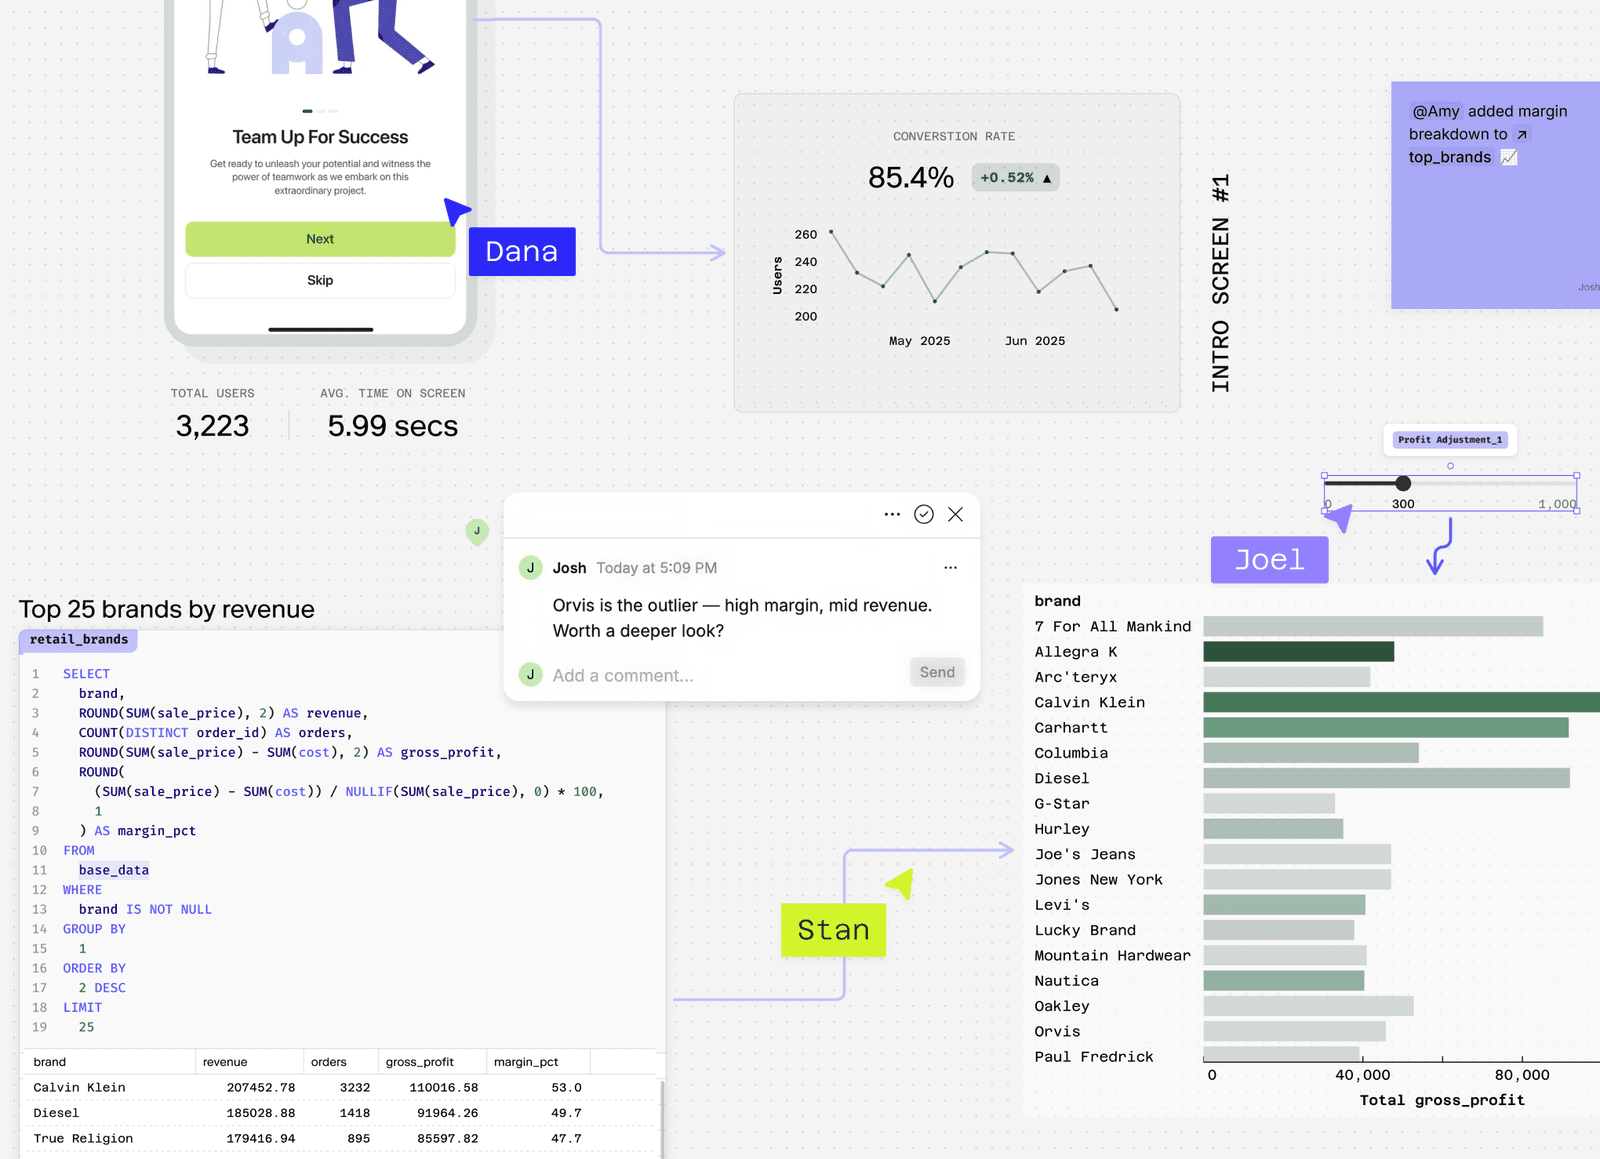
User Engagement Score: A Health Check for Your Product
A User Engagement Score distills complex user behavior into a single number, showing if users find value or are at risk of churning. Product teams use it to gauge feature adoption, while success teams identify at-risk accounts.
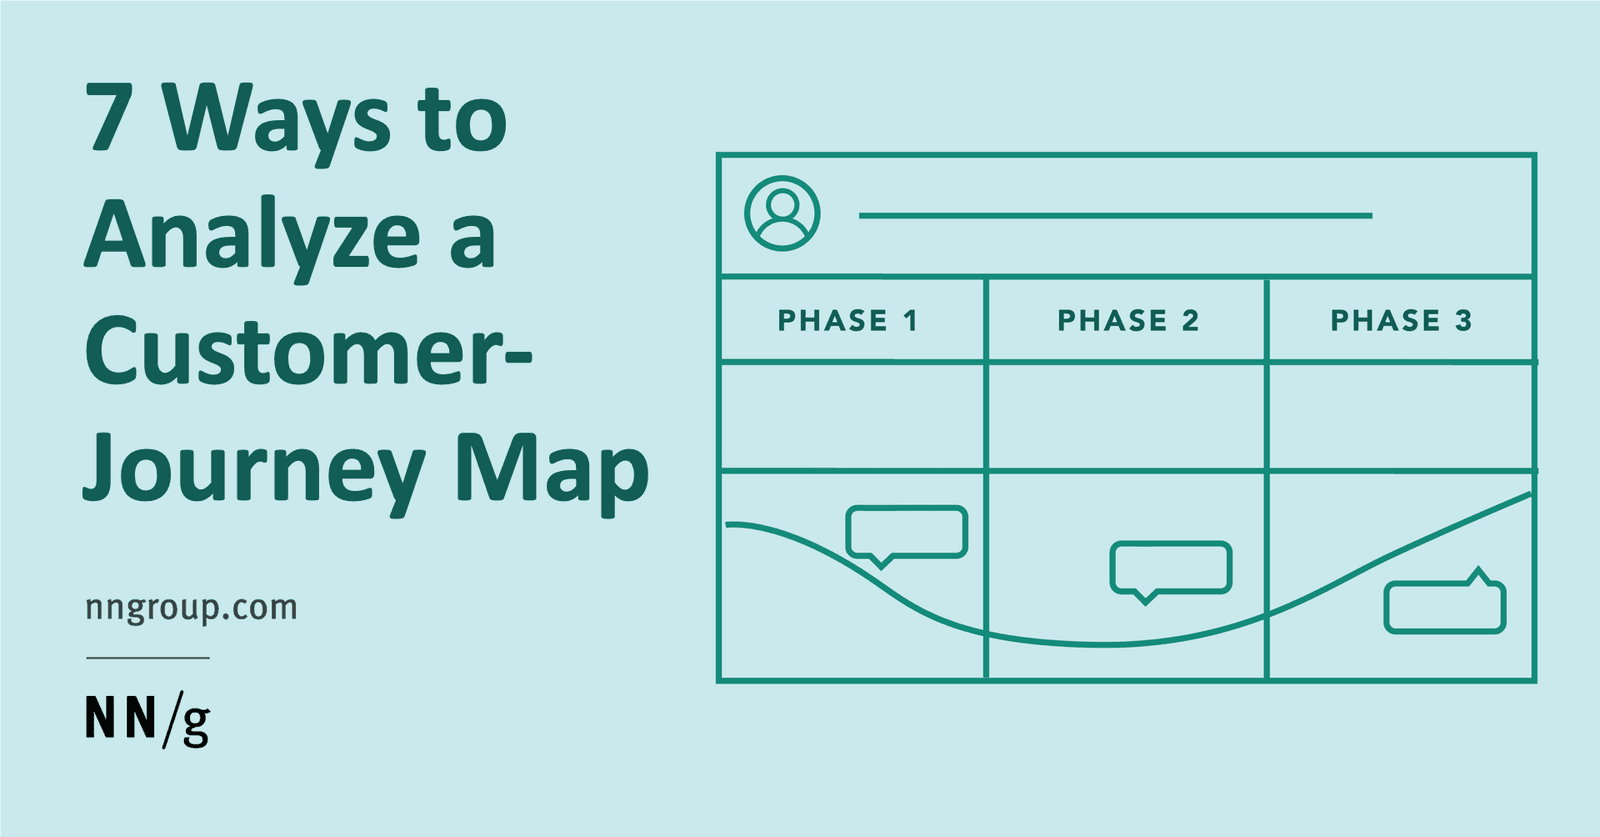
User Journey Analysis: Finding Friction and Opportunity
User journey analysis is like watching a film of your customer's experience to find plot holes. It helps spot where a product fails to meet expectations or has redundant steps. The biggest footgun is analyzing without a clear persona in mind.
Feature Adoption Rate: Measuring if New Features Deliver Value
Feature adoption rate measures if users actually use specific features, not just log in. It's vital for SaaS products to prove ongoing value for renewals. The footgun: a low rate means customers pay for unused bloat, which actively hurts perceived value and…
Activation Rate: Measuring the 'Aha!' Moment
Activation rate measures the percentage of users who experience your product's core value, not just sign up. It's a key metric for diagnosing onboarding effectiveness. The common mistake is tracking 'completed onboarding' instead of the 'aha!'
Databricks: The Unified Platform for Data and AI
Databricks unifies your data warehouse and data lake into a single 'Lakehouse' platform. It's used for building ETL pipelines, training ML models, and running BI queries on the same data. The main footgun is cost: its power can lead to surprise bills.
Apache Spark: A Unified Engine for Big Data
Think of Apache Spark as a general-purpose engine for large-scale data analytics. It lets you program an entire cluster of machines as one, automatically handling data parallelism and fault tolerance so you can focus on the analysis itself.
Snowplow: A Private Pipeline for Event Data
Think of Snowplow not as an analytics tool, but as a private pipeline you own for creating high-quality event data. It collects raw events, validates them against schemas, and loads them into your warehouse. The footgun is expecting turnkey dashboards.
Apache Kafka: A Distributed Log for Data Streams
Think of Kafka as a durable, append-only log for events, not just a temporary message queue. It excels at handling high-throughput, real-time data feeds for analytics or log aggregation. The footgun is treating it like a simple broker, leading to data loss.
Segment: The Universal Translator for Customer Data
Segment is a universal translator for customer data. Track an event once in your app, and Segment forwards it to all your marketing and analytics tools, saving you from building dozens of separate integrations.
Looker: Google's Data Analytics Platform
Looker is Google Cloud's data analytics platform that creates a single source of truth for metrics. It uses a modeling language, LookML, to define business logic on top of your database.
dbt: Managing Data Transformations as Code
dbt treats your data transformations as a software project, letting you build, test, and version control your SQL. It's the 'T' in the modern ELT paradigm. Use it to create reliable data models in a warehouse. The footgun: dbt only transforms data.
Amplitude: Analytics for Understanding User Behavior
Think of Amplitude as a DVR for user actions, not just a traffic counter. It tracks what users *do* inside your app, letting you build funnels and segment users by behavior.
Google BigQuery: A Serverless Data Warehouse
Think of BigQuery as a massive SQL database you don't have to manage. It's a serverless data warehouse for analyzing huge datasets, like terabytes of application logs. The footgun is treating it like a regular database for real-time transactions.
Jupyter Notebooks: Interactive Code Sandboxes
Jupyter Notebooks are digital lab notebooks for running code, seeing output, and writing notes in one place. Data scientists use them for exploration, visualization, and prototyping.
Google Analytics 4
Google Analytics is a service for tracking user activity across websites and mobile apps. It helps measure marketing performance by tracking traffic and user 'events'. The footgun is focusing on raw traffic instead of the events that signal valuable actions.
Workforce Analytics: Data-Driven People Decisions
Workforce Analytics applies systematic data analysis to people-related decisions, moving beyond gut feelings for hiring and promotions. It's used to predict turnover or measure training ROI.
Business Analytics vs. Business Intelligence
Business Analytics predicts the future and prescribes actions, while Business Intelligence describes the past. BI reports last month's sales; BA forecasts next month's demand.