More in AI & ML — page 29
What metrics track e-commerce user engagement and how do you prioritize them?
WHAT IT TESTS: translating vague goals into measurable product journey indicators. ANSWER OUTLINE: propose DAU/MAU, adoption, retention, and stickiness; prioritize by impact on trial conversion and churn. RED FLAG: vanity metrics untied to conversion or churn.
ML Model Registry: Source of Truth for Production Models
A model registry is version control for trained models, not just code. It tracks which artifact is running in production, who approved it, and how it was built. Skip it and you get untracked files in S3 with no way to reproduce a production model.
Spark Structured Streaming: Unify Batch and Stream
Spark Structured Streaming treats a live stream as an unbounded DataFrame. It unifies batch and streaming ETL on Kafka, but the footgun is confusing event time with processing time without watermarks, which silently drops late data.
Vectorization: Ditch the Python Loop
Vectorization means issuing one batch command to C-backed arrays instead of looping in Python. Use it for million-row DataFrames or matrix math. The footgun is treating apply() as vectorized, or silently materializing giant temporaries that exhaust RAM.

ML Pipeline: Systematic Model Delivery
A machine learning pipeline is the systematic workflow that carries models from data labeling through deployment inside MLOps. It keeps the AI lifecycle repeatable rather than ad hoc. The footgun is treating a one-off notebook as a production pipeline.
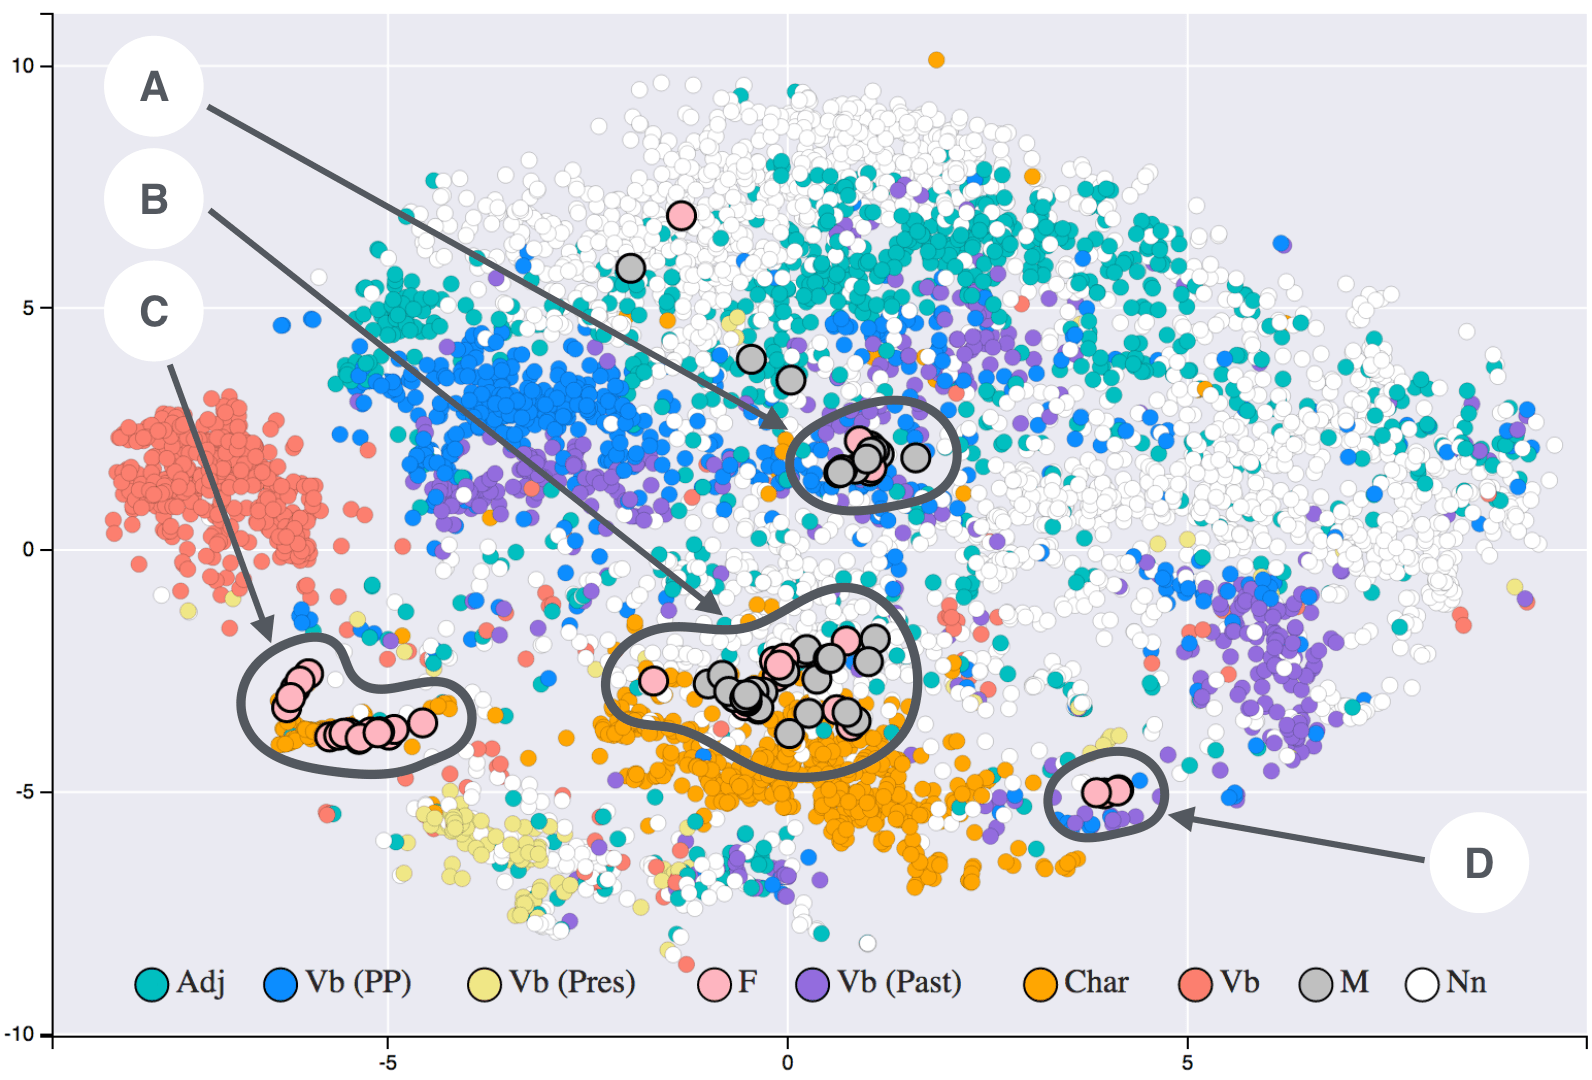
t-SNE: Map High-Dimensional Similarity to 2D
t-SNE turns high-dimensional similarity into 2D or 3D distance: similar points cluster and dissimilar points separate. Use it to visualize complex datasets on a flat map. Do not read exact distances from the plot; it preserves local probability, not geometry.

ETL: The Three-Phase Data Pipeline
ETL is a three-phase pipeline: extract from sources, transform, and load into containers. It supports many sources and destinations and runs as automated software, manual jobs, or scheduled batches. The footgun is manual execution of recurring jobs.

SVD: Eigendecomposition for Any Matrix
SVD treats any matrix as rotation, then scaling, then rotation. It generalizes eigendecomposition beyond square normal matrices to any real or complex matrix.
MLE: Find the Parameters That Make Data Likely
MLE tunes your model until observed data looks inevitable. Use it to fit distributions to logs, traffic, or errors. The footgun: it assumes your distribution family is correct; under a wrong model, it finds the best-fitting wrong answer with high confidence.
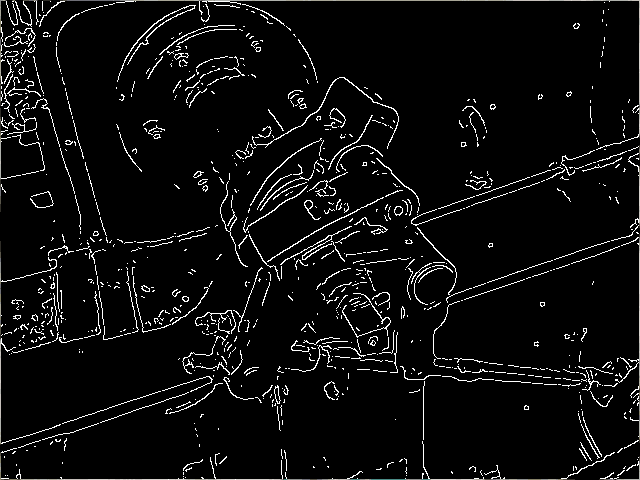
Walk me through Canny edge detection and why it beats Sobel thresholding
Tests multi-scale edge detection and noise robustness versus raw gradient thresholding. Strong answer lists Gaussian blur, Sobel gradients, non-maximum suppression, double thresholding, hysteresis. Red flag: calling it blurred Sobel without hysteresis or NMS.

How does filter separability optimize Gaussian blur and its complexity?
This tests if you know a 2D Gaussian separates into two 1D convolutions. A strong answer gives complexity as O(N^2 K^2) dropping to O(N^2 K) for an N-by-N image and K-by-K kernel. A red flag is claiming all kernels are separable or omitting dimensions.

Zero-padding vs reflect vs replicate padding and their visual artifacts
This tests boundary assumptions in convolution. Zero-padding adds black borders causing dark vignettes; reflect padding mirrors edges for continuity; replicate padding repeats edge values outward. A red flag is saying padding choice does not affect outputs.
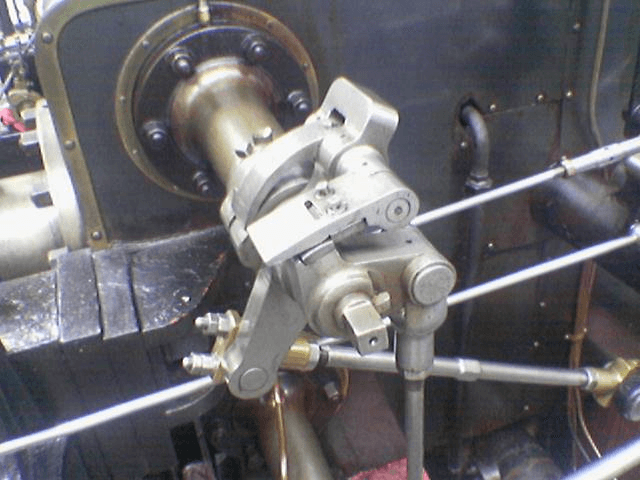
How does the Sobel operator approximate image gradients for edge detection?
This tests discrete gradient approximation via separable convolution. A strong answer covers 3x3 Gx and Gy kernels as smoothed central differences, then combines magnitude as sqrt(Gx^2 + Gy^2) or L1 norm. A red flag is treating them as arbitrary blur filters.
What is an image histogram and how does histogram equalization improve contrast?
WHAT IT TESTS: Whether you understand intensity distributions and CDF-based remapping. ANSWER OUTLINE: Define a histogram as pixel counts per intensity; explain equalization normalizes the CDF to spread intensities across the full range.

How would you implement a simple box blur on a grayscale image?
WHAT IT TESTS: Spatial convolution and image filtering basics. ANSWER OUTLINE: Iterate interior pixels, sum the N by N neighborhood, divide by kernel area, write to a new buffer. RED FLAG: In place updates that blur already blurred values.

Describe the BRDF, its advantage over Lambertian, and critical CV tasks
Tests 4D view-dependent reflectance. Strong answers define BRDF as dL_r/dE_i (sr^-1) over four angles; note Lambertian is isotropic; cite photometric stereo and shape-from-shading where specularity breaks the model. Red flag: calling it albedo.
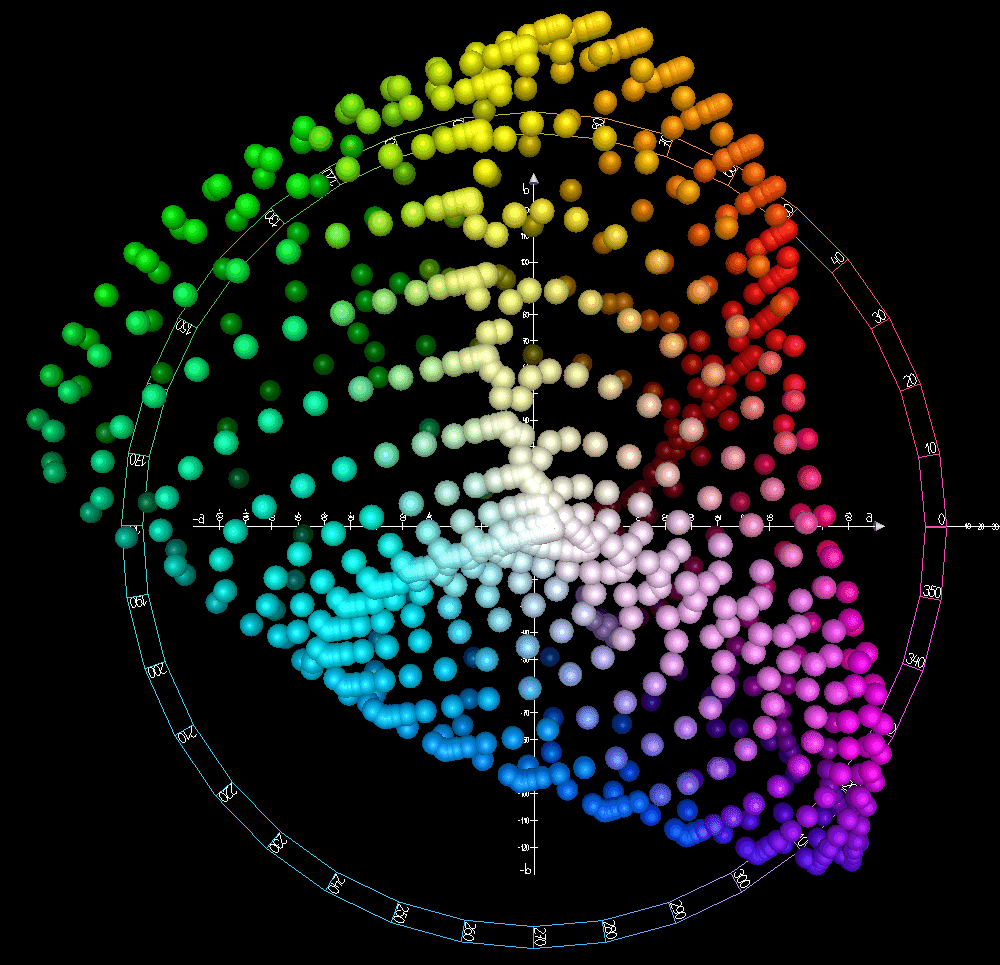
Why is RGB Euclidean distance a poor measure of perceptual color difference?
This tests perceptual uniformity. A good answer explains that RGB distance does not match human vision, then describes CIELAB as a space where deltas approximate perceived differences, making segmentation align with human vision.
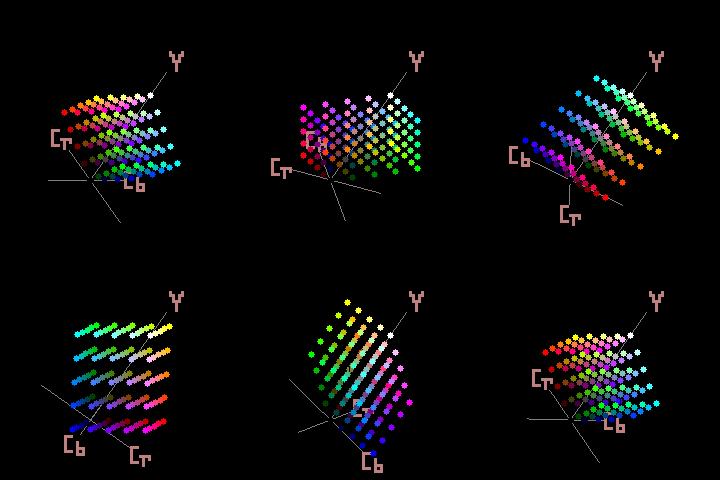
Compare YCbCr and RGB. Why chroma subsampling for compression?
Tests color decorrelation and perceptual redundancy. Contrast correlated RGB with YCbCr's luma-chroma split; eyes resolve brightness better than color, so 4:2:0/4:2:2 cuts chroma bandwidth ~50-75% with little loss.
How does a Bayer filter capture color and what is demosaicing?
This tests CFA sampling tradeoffs. The answer covers the RGGB mosaic, demosaicing as interpolation of missing channels, and moire or zippering artifacts. A red flag is believing pixels capture full RGB natively or that demosaicing is only averaging.

Explain the pinhole camera model and intrinsic matrix K
Tests projective geometry and mapping sensor properties to K. Good answers derive perspective projection via similar triangles, list fx, fy, cx, cy, skew, and explain pixel scaling. Red flag: mixing intrinsics with extrinsics or saying K includes distortion.